Hallo 
Can I add Range Slider to the chart with only shapes ?? How to do that ??
In the picture there is Range Slider but I think it should display 2 shapes: empty rect and fill rect.
Thanks in advance!!
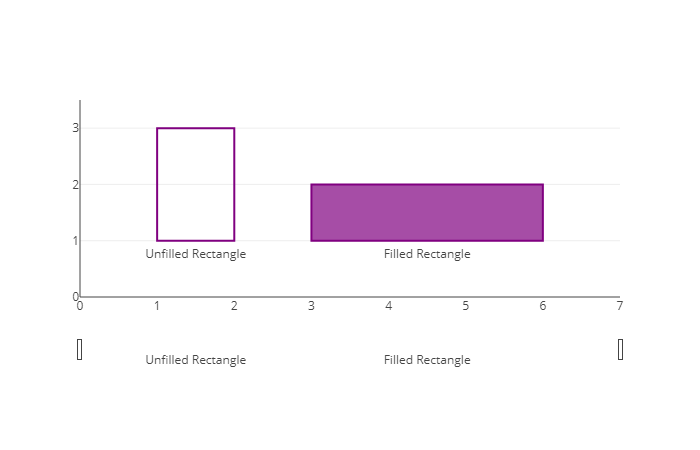
Hallo
Can I add Range Slider to the chart with only shapes ?? How to do that ??
In the picture there is Range Slider but I think it should display 2 shapes: empty rect and fill rect.
Thanks in advance!!
Thanks for the report.
In addition when I turn off element in legend It does not disappear in this chart. There is a chance that this 2 bugs will be fixed in next version (python) ?
You are doing great work with plotly ! 