Range slider (date) with multiple traces

I have two sets of data points with the same datetime values. I am trying to plot the two together overtime, and add a slider to filter down the dates to specific ranges (as was done in https://plot.ly/python/range-slider/#basic-range-slider-and-range-selectors).

While it seems like the slider was created properly (i simply used the same code as suggested in the tutorial as a first try), the dates there are around 2000-2004, while my date ranges are 2016-2019. I canโ€™t seem to see my data at all, although it appears in the legend.
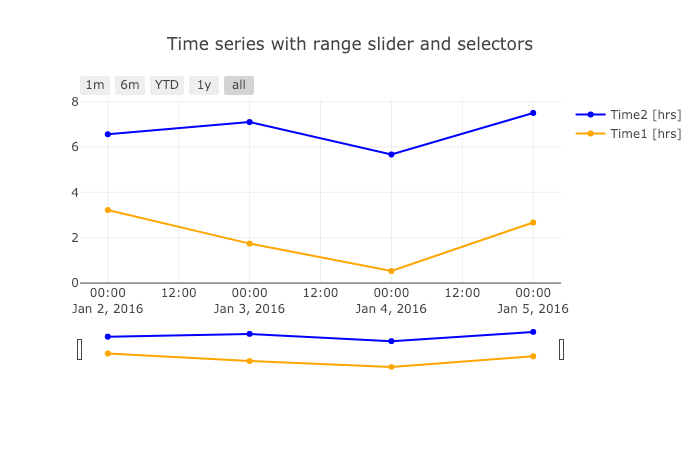
This was my setup:

df looks like:

index    date               time_spent1     time_spent2
0         2016-01-02        3.22                6.56
1         2016-01-03        1.74                7.10
2         2016-01-04        0.53                5.67
3         2016-01-05        2.67                7.50

The code:

import pandas as pd
import plotly.plotly as py
import plotly.graph_objs as go

trace1 = go.Scatter(
        x = list(df.date),
        y = list(df.time_spent2),
        mode = 'lines+markers',
        name = 'Time2 [hrs]',
        marker = dict(
                color = 'blue'
                )
        )

trace2 = go.Scatter(
        x = list(df.date),
        y = list(df.time_spent1),
        mode = 'lines+markers',
        name = 'Time1 [hrs]',
        marker = dict(
                color = 'orange'
                )
        )

data = [trace1, trace2]

# slider set up:
layout = dict(
    title='Time series with range slider and selectors',
    xaxis=dict(
        rangeselector=dict(
            buttons=list([
                dict(count=1,
                     label='1m',
                     step='month',
                     stepmode='backward'),
                dict(count=6,
                     label='6m',
                     step='month',
                     stepmode='backward'),
                dict(count=1,
                    label='YTD',
                    step='year',
                    stepmode='todate'),
                dict(count=1,
                    label='1y',
                    step='year',
                    stepmode='backward'),
                dict(step='all')
            ])
        ),
        rangeslider=dict(
            visible = True
        ),
        type='date'
    )
)

fig = dict(data=data, layout=layout)
py.iplot(fig, filename='temp1')

Suggestions how to fix this?

Hi @guy,

Could you add the imports and some sample data to make this example reproducible? It will be much easier for folks to help out if they can reproduce what youโ€™re seeing.

-Jon

Yes - thanks for the comment. Iโ€™ve edited the post to include that.

Hi @guy,

Hmm, when I try this example it looks like things are working for me. Hereโ€™s my full example

import pandas as pd
import plotly.plotly as py
import plotly.graph_objs as go
from plotly.offline import iplot, init_notebook_mode
init_notebook_mode()

df = pd.DataFrame({
    'date': pd.to_datetime(['2016-01-02', '2016-01-03', '2016-01-04', '2016-01-05']),
    'time_spent1': [3.22, 1.74, 0.53, 2.67],
    'time_spent2': [6.56, 7.10, 5.67, 7.50]
})

trace1 = go.Scatter(
        x = list(df.date),
        y = list(df.time_spent2),
        mode = 'lines+markers',
        name = 'Time2 [hrs]',
        marker = dict(
                color = 'blue'
                )
        )

trace2 = go.Scatter(
        x = list(df.date),
        y = list(df.time_spent1),
        mode = 'lines+markers',
        name = 'Time1 [hrs]',
        marker = dict(
                color = 'orange'
                )
        )

data = [trace1, trace2]

# slider set up:
layout = dict(
    title='Time series with range slider and selectors',
    xaxis=dict(
        rangeselector=dict(
            buttons=list([
                dict(count=1,
                     label='1m',
                     step='month',
                     stepmode='backward'),
                dict(count=6,
                     label='6m',
                     step='month',
                     stepmode='backward'),
                dict(count=1,
                    label='YTD',
                    step='year',
                    stepmode='todate'),
                dict(count=1,
                    label='1y',
                    step='year',
                    stepmode='backward'),
                dict(step='all')
            ])
        ),
        rangeslider=dict(
            visible = True
        ),
        type='date'
    )
)

fig = dict(data=data, layout=layout)
iplot(fig)

Is your date column a pandas datetime array?

>>> print(df.dtypes)

date           datetime64[ns]
time_spent1           float64
time_spent2           float64
dtype: object

What version of plotly.py are you using?

>>> plotly.__version__
'3.5.0'

-Jon

I thought it was supposed to be, since I copied it from another dataframe where it was datatime, but it was indeed just an object in df.
Thanks for the fix!

1 Like