px.Choropleth not showing location outlines

I have a custom geojson outlining the five geographical regions of Brazil. Here’s what it looks like on an online visualizer:
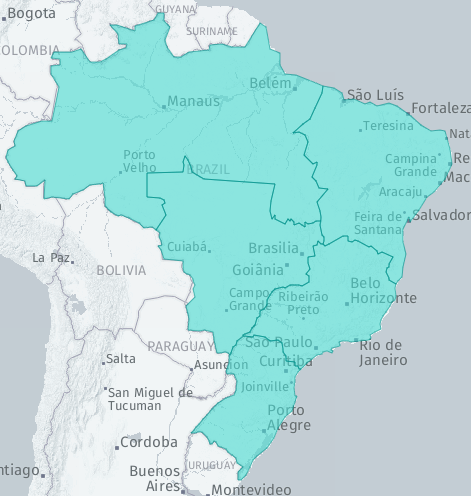
chrome_ffrGgglPm1

And here’s what the geojson looks like:

{
  "type": "FeatureCollection",
  "features": [
    {
      "type": "Feature",
      "properties": {
        "shape": "Polygon",
        "id": "sudeste"
      },
      "geometry": {
        "type": "Polygon",
        "coordinates": [...]
      }
    },
    {
      "type": "Feature",
      "properties": {
        "shape": "Polygon",
        "id": "sul"
      },
      "geometry": {
        "type": "Polygon",
        "coordinates": [...]
      }
    },
    {
      "type": "Feature",
      "properties": {
        "shape": "Polygon",
        "id": "nordeste"
      },
      "geometry": {
        "type": "Polygon",
        "coordinates": [...]
      }
    },
    {
      "type": "Feature",
      "properties": {
        "shape": "Polygon",
        "id": "centro-oeste"
      },
      "geometry": {
        "type": "Polygon",
        "coordinates": [...]
      }
    },
    {
      "type": "Feature",
      "properties": {
        "shape": "Polygon",
        "id": "norte"
      },
      "geometry": {
        "type": "Polygon",
        "coordinates": [...]
      }
    }
  ]
}

Pastebin to the full GeoJSON

This is my code creating the choropleth:

with open('Datasets/Destaques/regions.json') as f:

        geojson = json.load(f)

    data = {

        "regions": ["sudeste", "sul", "nordeste", "centro-oeste", 'norte'],

        "value": [0.1,0.3,0.5,0.7,0.9]

    }

    df = pd.DataFrame(

        data,

        columns = ["regions", "value"]

    )

    figure = px.choropleth(

        data_frame = df,

        geojson = geojson,

        locations = "regions",

        featureidkey="properties.id",

        title = "Brazil",

        scope = "south america"

    )

    figure.update_geos(fitbounds="locations", visible=False)

    figure.show()

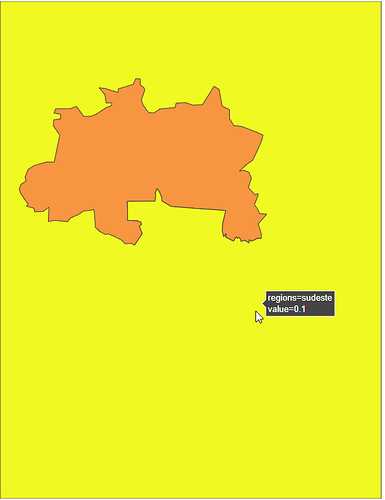
When I this is the result I get:

You can see that I the regions still exist, since when I mouseover where they should be, the hoverdata is correct. However, I want all the outlines to always be shown and filled, and the background to not be filled. How can I do that?

Hi @RafaUL you should pass color='value' to px.choropleth or the chart does not know what to display. Does it make a difference?

Hi @Emmanuelle!

Not really, it only changes the background color and the color of the region, the other regions are still invisible.

I have changed my code to be more similar to the example shown in the documentation:

with open('Datasets/Destaques/regions.json') as f:

        geojson = json.load(f)

    data = {

        "region": ["sudeste", "sul", "nordeste", "centro-oeste", 'norte'],

        "parity": ["odd", "even", "odd", "even", "odd"]

    }

    df = pd.DataFrame(

        data,

        columns = ["region", "parity"]

    )


    figure = px.choropleth(

        df,

        geojson = geojson,

        color = "parity",

        locations = "region",

        featureidkey="properties.region",

        projection="mercator"

    )
    figure.update_geos(fitbounds="locations", visible=False)
    figure.update_layout(margin={"r":0,"t":0,"l":0,"b":0})

    figure.show()

Now, I get this, when both even and odd are toggled on (or just even):

And this when only odd is toggled on:

So the locations do exist and are defined in the geojson, they just don’t get displayed properly…