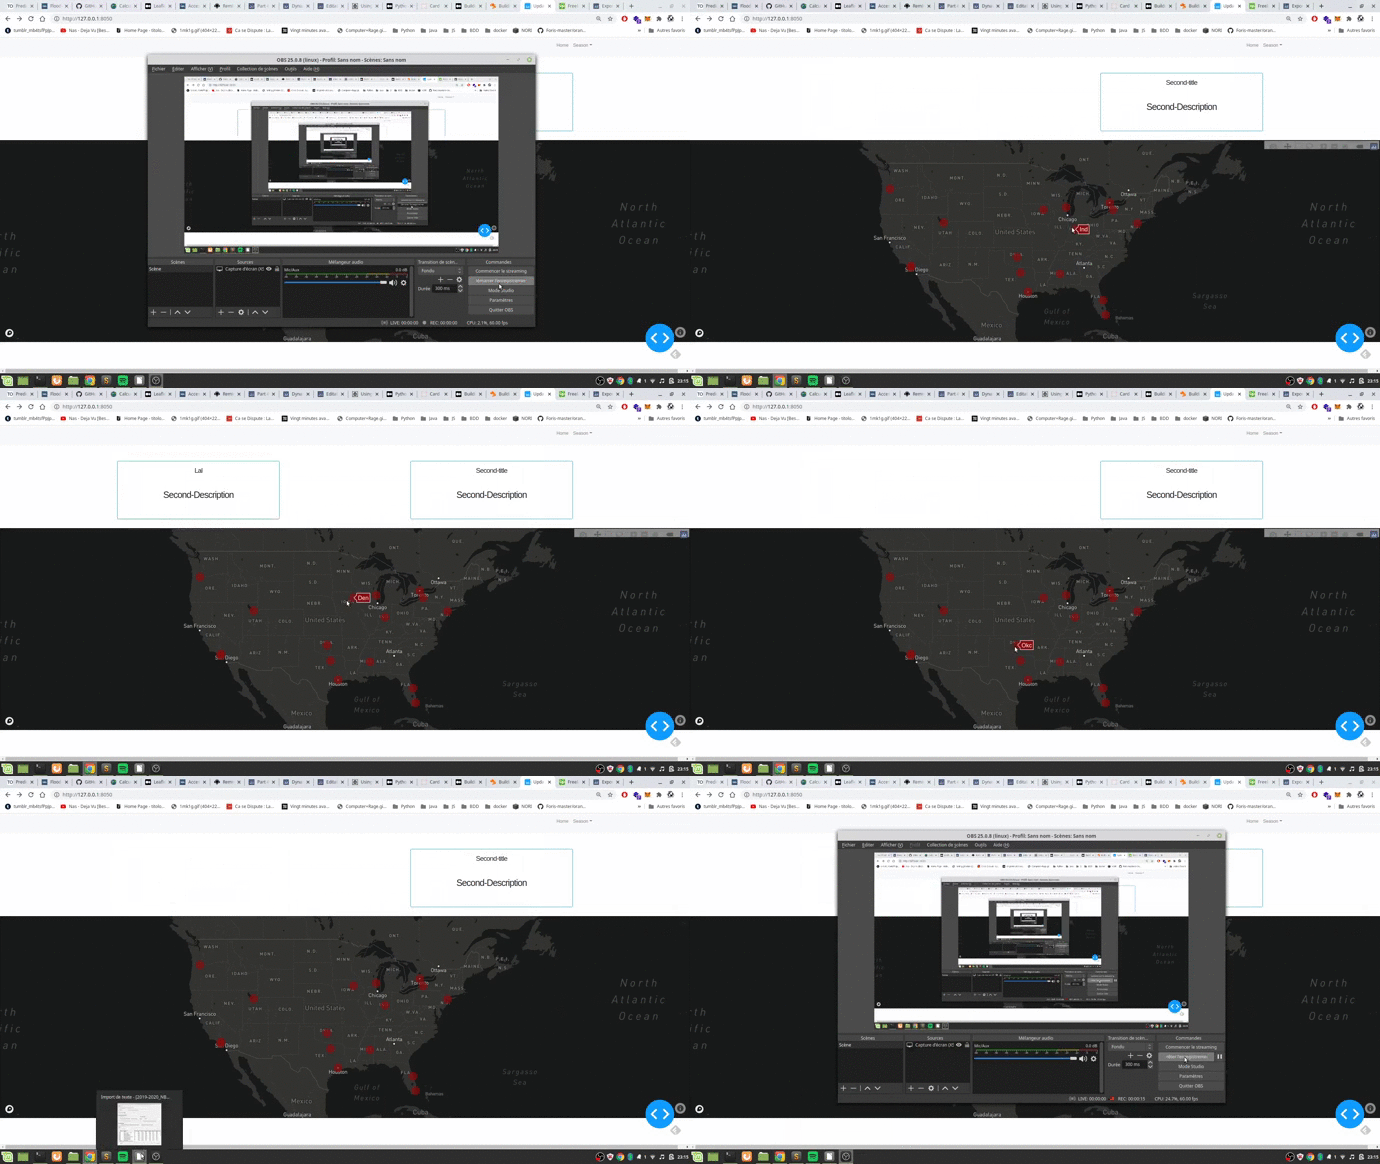
Hello,
I’m learnin dash for a month now and i’m trying to populate my bootstrap card with hoverdata from my scattermapbox map, taking example on this tutorial.
It works but only for a short time and it looks like datas inside dbc.card keep refreshing all time even without user action 
import dash_core_components as dcc
import dash_html_components as html
from dash.dependencies import Input, Output
from dash.exceptions import PreventUpdate
import dash_bootstrap_components as dbc
import dash_table
import pandas as pd
import plotly.graph_objects as go

from app import app
from apps.utils import create_card

teamPlayoffs =pd.read_csv('https://github.com/jnditifei/nbastats/blob/main/2019-2020_NBA_team_playoffs.csv')

maps= go.Figure()

access = ("")

maps.add_trace(go.Scattermapbox(
        lat=teamPlayoffs['lat'],
        lon=teamPlayoffs['lon'],
        mode='markers',
        hovertext=teamPlayoffs['short'],
        hoverinfo="text",
        marker=go.scattermapbox.Marker(
            size=20,
            color='rgb(138, 11, 11)',
            opacity=0.7
        )
    ))

maps.update_layout(
    autosize=True,
    hovermode='closest',
    showlegend=False,
    mapbox=dict(
        accesstoken=access,
        bearing=0,
        center=dict(
            lat=38,
            lon=-94
        ),
        pitch=0,
        zoom=3,
        style='light'
    ),
    mapbox_style="dark", margin = dict(l = 0, r = 0, t = 0, b = 0,)
    )

first_row = dbc.Row([
    dbc.Col(
        id="first", width={"size": 3, "order": 1, "offset": 2}
    ),
    dbc.Col(
        children=create_card("Second-title", "Second-Description"), width={"size": 3, "order": 1, "offset": 2}
    ),
                     ])

layout = html.Div([
    first_row,
    dbc.Row(dbc.Col(dcc.Graph(id='map',figure=maps, hoverData={'points': [{'hovertext': 'Lal'}]}), style={"margin-top":"20px"}
        ),
    )
])

@app.callback(
    Output('first','children'),
    [Input('map', 'hoverData')]
    )
def upgrade_card(hoverData):
    title = hoverData['points'][0]['hovertext']
    return create_card(title, "Second-Description")
I also tried inside an html.Div i have the same result
Sorry for my poor english i hope you understand me.