Sorry, new here:
Can someone explain the transformation that my x-axis is undergoing when I use the stack option?
It looks like it’s a % maybe? I appreciate any resources you can give.
Thanks!
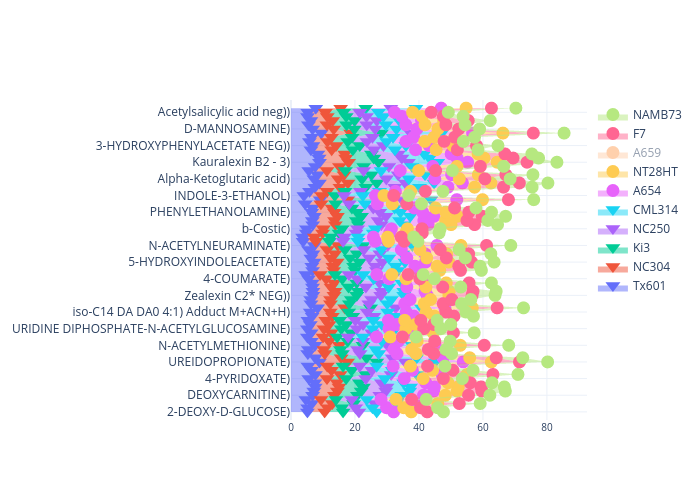
X-axis is a Log10 value

After stacking X-axis is a value is 0-100