Hi,
I made this inquiry on the RStudio Community forum some time ago and reformulate it here since I probably posted it on the wrong forum.
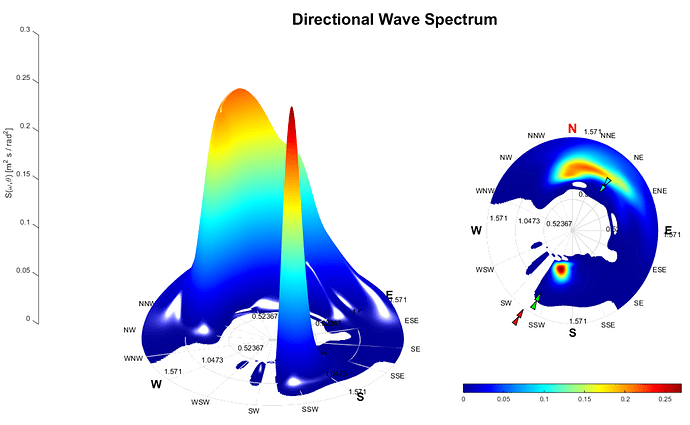
With regards to orientation in an earth coordinate system it is beneficial to apply polar coordinates for plotting. As per now it seems like plotly currently supports 2D polar graphs but not 3D (similar to the below example generated in Matlab). Are there any plans to expand the current polar plot capability (from 2D to 3D) also making it possible to visualize surface plots in a cylindrical coordinate system?
BR
Frank
