Hello,
I am trying to create a 3D Streamtube plot of magnetic field lines, using Python (code for an equivalent but simpler plot pasted below). But when I run my code the plot shows empty (i.e. no plot in the plot area). I am relativity new to Plotly, having used Mayavi and other libraries in the past.
Can anyone give me advice about what I am doing wrong?
Thank you!
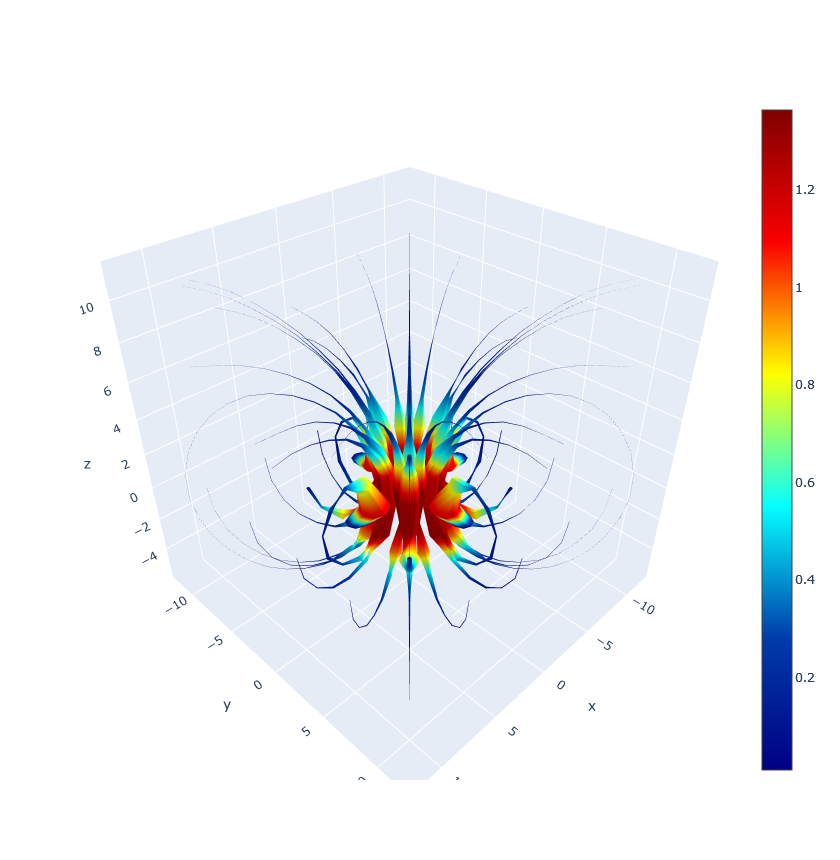
Here is the Python code. It is not the one I am trying to plot, but an equivalent, albeit simpler, one. It computes the magnetic field created by a ring of current. The vector components are computed on a 3d grid, and then the goal is to plot the field lines of said field. The x_pos, y_pos, z_pos was an attempt at creating starting points for the streamtubes, still did not work.
import scipy.integrate as spi
import numpy as np
import plotly.graph_objs as go
import plotly.io as pio

pio.renderers.default='browser'

R = 4.0
mu_0 = 4*np.pi
I = 10.0

def integrate(func, lo, hi, *args):
    return np.vectorize(lambda n, m, z: spi.quad(func, lo, hi, (n, m, z)+args)[0])

def dBx(theta,x,y,z):
    return ((mu_0*I)/(4*np.pi))*(R*z*np.cos(theta))/((x-R*np.cos(theta))**2 +(y-R*np.sin(theta))**2+z**2)**(3/2)

def dBy(theta,x,y,z):
    return ((mu_0*I)/(4*np.pi))*(R*z*np.sin(theta))/((x-R*np.cos(theta))**2+(y-R*np.sin(theta))**2+z**2)**(3/2)

def dBz(theta,x,y,z):
    return ((mu_0*I)/(4*np.pi))*(((-R)*((np.sin(theta)*(y-R*np.sin(theta)))+(np.cos(theta)*(x-R*np.cos(theta)))))/ \
           ((x-R*np.cos(theta))**2+(y-R*np.sin(theta))**2+z**2)**(3/2))

x, y, z = np.mgrid[-10:10:10j,-10:10:10j,-10:10:10j]

Bx, By, Bz = [integrate(func, 0, 2*np.pi)(x,y,z)
              for func in (dBx, dBy, dBz)]

Bx, By, Bz = np.array(Bx), np.array(By), np.array(Bz)

x, y, z, Bx, By, Bz = x.flatten(), y.flatten(), z.flatten(), Bx.flatten(), By.flatten(), Bz.flatten()

Bx, By, Bz = Bx/np.max(Bx), By/np.max(By), Bz/np.max(Bz)

x, y, z, Bx, By, Bz = x.tolist(), y.tolist(), z.tolist(), Bx.tolist(), By.tolist(), Bz.tolist()

x_pos, y_pos, z_pos = np.mgrid[-10:10:5j,-10:10:5j,0:0:5j]
x_pos, y_pos, z_pos = x_pos.flatten(), y_pos.flatten(), z_pos.flatten()
x_pos, y_pos, z_pos = x_pos.tolist(), y_pos.tolist(), z_pos.tolist()

data_plot = [go.Streamtube(
    x=[x], y=[y], z=[z], u=[Bx], v=[By], w=[Bz],
    starts = dict(
        x = x_pos,
        y = y_pos,
        z = z_pos),
    sizeref = 0.3,
    colorscale = 'jet',
    showscale = True,
    maxdisplayed = 300
    )]

fig = go.Figure(data=data_plot)

fig.show()