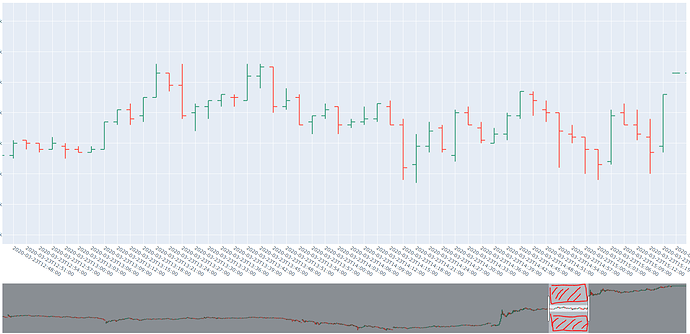
Not only candlestick, Plotly figures have rangeslider as xaxis’s child. line, scatter, etc.
Problem is plotly doesn’t adjust yaxis’s range. when i zoom or pan with rangeslider.
It’s important. when i zoom with fixed yaxis range (not box zoom).
echarts and tradingview’s candlestick chart could be an example. panning chart, yaxis is being adjusted automatically.
I solved it temporary. Dash ‘relayout’ callback and adjust yaxis range.
ohlcfig= go.Figure({
    'data': [{
        'type': 'ohlc',
        'x': dfmin.index,
        'open': dfmin['open'],
        'high': dfmin['high'],
        'low': dfmin['low'],
        'close': dfmin['close'],
        'xaxis': 'x',
        'yaxis': 'y'
    }],
    'layout':{
        'height': 1000,
        'xaxis': {
            'type': 'category',
            'rangeslider': {
                'yaxis': {
                    'rangemode': 'auto'
                }
            },
        },
    }
})

...

@app.callback(
    Output('stock-chart', 'figure'),
    [Input('stock-chart', 'relayoutData')])
def display_relayout_data(relayoutData):
    global ohlcfig
    start = end = 0

    if not relayoutData:
        raise PreventUpdate

    if relayoutData.get('xaxis.autorange', False):
        ohlcfig.update_layout(xaxis_autorange=True, yaxis_autorange=True)

    elif relayoutData.get('xaxis.range[0]', False):
        start = relayoutData['xaxis.range[0]']
        end = relayoutData['xaxis.range[1]']

        sidx = int(start)
        eidx = int(end)

        ymax = dfmin['high'].iloc[sidx:eidx].max() + 1000
        ymin = dfmin['low'].iloc[sidx:eidx].min() - 1000

        ohlcfig.update_layout(xaxis_autorange=False, yaxis_autorange=False,
                                        xaxis_range=[start, end], yaxis_range=[ymin, ymax])

    else:
        raise PreventUpdate

    return ohlcfig
but, still has some problems. First, explain with this image. panning area and zooming area in the minimap(rangeslider).
Last, it doesn’t override rangeslider zoom/pan behavier, it just overwrite after rangeslider zoom/pan finished.
echart provides ‘dataZoom’ option.
dataZoom: [
        {
            type: 'inside',
            start: 50,
            end: 100
        },
        {
            show: true,
            type: 'slider',
            top: '90%',
            start: 50,
            end: 100
        }
    ],
I’ve read all related threads in this community ‘rangeslider autoscale yaxis’. nobody suggest helpful solution. so I hope plotly developer can solve this.

