Hello!
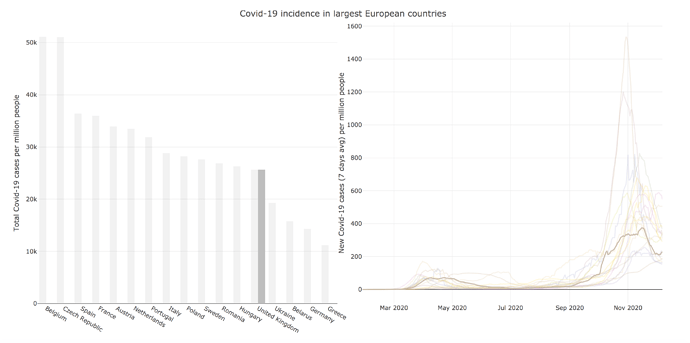
I am doing a subplot with a linked barchart and line chart
library(readr)
library(dplyr)
library(plotly)
library(crosstalk)
library(forecast)
library(ggplot2)
library(tidyverse)
library(readr)


data <- read.csv(url("https://covid.ourworldindata.org/data/owid-covid-data.csv"))
data$date <- as.Date(data$date)

shared_data <- SharedData$new(data, key = ~location)

col <- shared_data %>%
  plot_ly() %>%
  mutate(location=as.character(location)) %>%
  filter(date == "2020-12-07") %>%
  filter(continent == "Europe" & location != "Russia" & population > 9000000) %>%
  mutate(location = fct_reorder(location, total_cases_per_million, .desc = TRUE)) %>%
  add_bars(x = ~location, y = ~total_cases_per_million, color = I("grey")) %>%
  layout(yaxis = list(title = "Total Covid-19 cases per million people")) %>%
  hide_legend()

lines <- shared_data %>%
  plot_ly() %>%
  filter(continent == "Europe" & location != "Russia" & population > 9000000) %>%
  add_lines(x = ~date, y = ~new_cases_smoothed_per_million, color = ~location) %>%
  layout(yaxis = list(title = "New Covid-19 cases (7 days avg) per million people"))


subplot(col, lines, titleY = TRUE) %>%
  hide_legend() %>%
  highlight(on = "plotly_hover") %>%
  layout(title = "Covid-19 incidence in largest European countries")
when I highlight, the bars of the bar chart get sort of split in two and only half of the one selected is highlighted. Can anyone know how to fix this bug?
