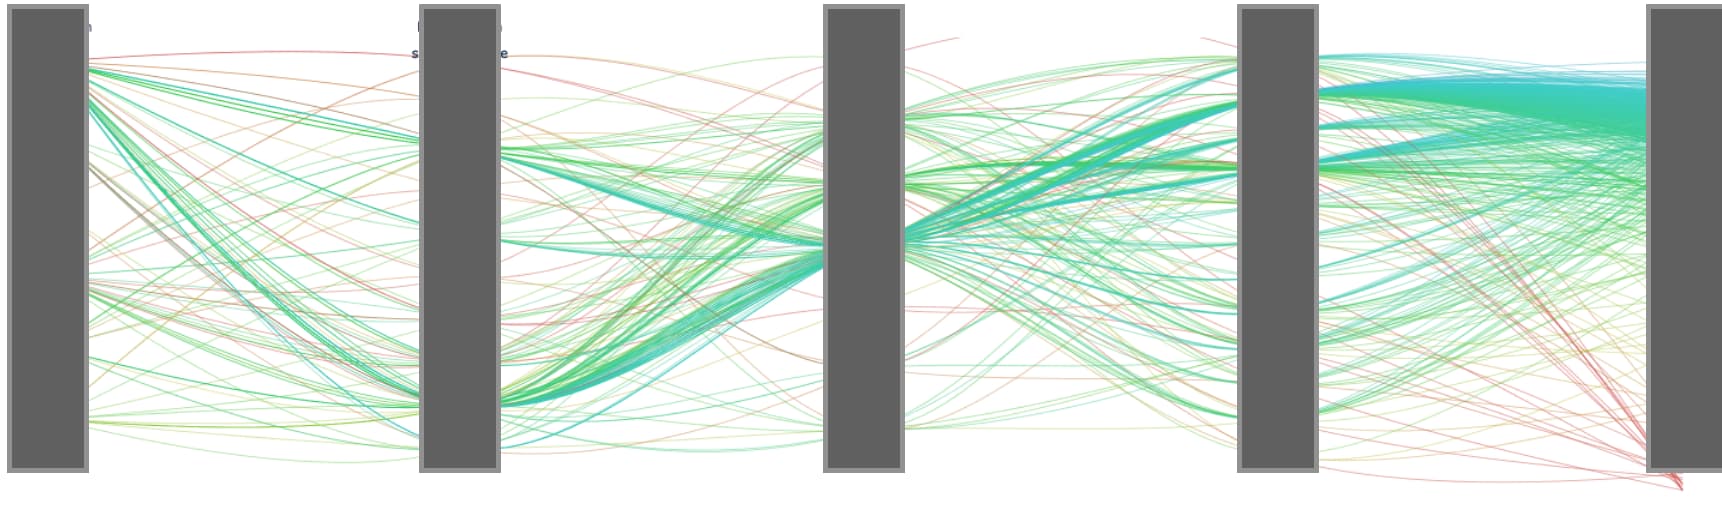
I would love to be able to do the parcoord plot with splines instead of straight lines.
That’s because I can see better when multiple traces lead to the same intermediate value but diverge on other values.
This is not possible with the straight line approach.
Hopefully the image example I posted shows up.