Hi
Is there a way to detect mouse right click on a chart?
I have integrated plotly in my application and need a way to detect mouse right click. Preferably with extra data as well.
I can’t seem to find any reference to it.
Any suggestion or work around?
Many thanks in advance.
plotly.js doesn’t expose a right-click event at the moment, so you’ll need to attach a regular DOM event on the graph div: http://codepen.io/etpinard/pen/XRWvaX?editors=1111
Thanks for the answer 
Hey!
I would like to reactivate the question…is there in the meantime a possibility for handling right click mouse event in my plotly js map when clicking on point? When clicking on a point in the map there should be a checkbox menu…
JsFiddle or Codepen example would be awesome! 
Kind regards…
would also be interested to know!
The plotly_click event is fired for any mouse button that is pressed including the wheel, to distinguish the button that is pressed, you just have to check the button value of event
	plotLayer.on('plotly_click', data => {
		switch (data.event.button){
			case 0:
				console.log('left click')
				break
			case 1:
				console.log('wheel click')
				break
			case 2:
				console.log('right click')
				break
		}
	})
Hey Saratoga, thx for this suggestion. I tried some stuff to make it work. But I cannot archieve it.
In my case only the left mouse click is firing and jumping into the “then” clause… wheel click or right mouse click are like muted…is there a way to overwrite “plotly_click”, so that also events like right mouse click are firing? Or any other workaround?
var myPlot = document.getElementById(chartid),
    data = [
        {
            type: "scattermapbox",
            text: info,
            lon: lon,
            lat: lat,
            marker: { color: '#0747A6', size: 10 }
        },
        {
            type: "scattermapbox",
            text: infoCritical,
            lon: lonCritical,
            lat: latCritical,
            marker: { color: "red", size: 15 }
        }
    ],
    layout = {
        dragmode: "zoom",
        mapbox: { style: "open-street-map", center: { lat: lat[0], lon: lon[0] }, zoom: 9 },
        margin: { r: 0, t: 0, b: 0, l: 0 }
    };


Plotly.newPlot(chartid, data, layout, { responsive: true });

myPlot.on('plotly_click', function(d) {
    console.log('d: ');
    console.log(d);

    var imageid = d.points[0]["text"].split(",")[0];
    switch (d.event.button) {
        case 0:
            console.log('left click');
            GetImage(imageid);
            break;
        case 1:
            console.log('wheel click');
            GetImage(imageid);
            break;
        case 2:
            console.log('right click');
            GetImage(imageid);
            break;
    }
});That’s weird because if it works for me as you can see in the image I got all 3 messages
On the other hand, in your code I see two observations, when you use newPlot (), the method is passed the Id of the div that contains the graph or the reference to that div that you obtained with the getElementById () method is passed, in your case you are passing the id of the container div but you are not putting it in quotes it should be something like this
Plotly.newPlot('chartid', data, layout, { responsive: true })
O well
Plotly.newPlot(myPlot, data, layout, { responsive: true })
correct it and see if it works for you
Hey Saratoga!
Indeed, it is weird! In other circumstances than my scattermapbox plot it does fire for all three mouse click events… like this codepen example does work properly:
I checked but I passed chartid from outside as ‘map’, this is why it works. unfortunately it is only working and firing for left mouse click. right mouse click and wheel click are still like muted…
try the following
	myPlot.addEventListener('mousedown', e => {
		switch (e.button){
			case 0:
				console.log('left click')
				break
			case 1:
				console.log('wheel click')
				break
			case 2:
				console.log('right click')
				break
		}
	})
This works as far as it goes, but the args don’t contain the ‘points’ member that we need for our sunburst chart to know which curve the user right-clicked on.
I recommend that you make a console.log of the information that plotly_click sends you and review it,
this.layer.on("plotly_click", data => {
    console.log(data)
})
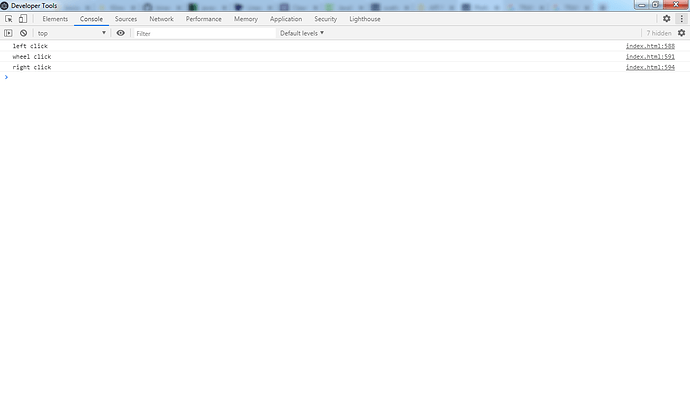
I give you a screenshot of the console.log with the three clicks (left, wheel, right) which means that plotly_click is triggered with any mouse button
Maybe the position of the buttons varies depending on the system, the browser or the mouse manufacturer, I don’t know, but it works for me on a Windows 10 system, in the Google browser and with a wireless Logitec brand mouse
I am using a sunburst chart. When I add code similar to yours:
         SunBurstChart.sunburstDiv.on('plotly_click',
             (args) => {
                 switch (args.event.button){
                     case 0:
                         alert("Left click!")
                         break
                     case 1:
                         alert("Wheel click!")
                         break
                     case 2:
                         alert("Right click!")
                         break
                 }
             });
I only get an alert for a left click, not for right or middle.
In the plotly code I see this:
   var onClick = function (pt) {
     // TODO: this does not support right-click. If we want to support it, we
     // would likely need to change pie to use dragElement instead of straight
     // mapbox event binding. Or perhaps better, make a simple wrapper with the
     // right mousedown, mousemove, and mouseup handlers just for a left/right click
     // mapbox would use this too.
which suggests that it’s a known limitation.
As I say, if I add these two handlers to my application:
         SunBurstChart.sunburstDiv.on('plotly_sunburstclick',
             (args) => {

         SunBurstChart.sunburstDiv.on('plotly_click',
             (args) => {
they only fire on a left click.
Is this a specific issue to the sunburst chart?
Incase, if anyone still looking for intercepting the right click on sunburst
the following code seems to work for me
        Plotly.newPlot(myRef.current, data,layout).then(gd=>{
            if(data[0]['type'] == 'sunburst'){
                console.log(gd)
                gd.oncontextmenu= ev => {
                    ev.preventDefault()
                    console.log(ev)
                    console.log(ev.srcElement.__data__.data.data)
                    }
            }
        });

