I am trying to have my subplots be grouped, rather than stacked. However, fig.update_layout({“barmode”: “group”}) does not seem to work.
My df as here:
import pandas as pd

df = pd.DataFrame({
  "segment1": ['blue', 'yellow', 'yellow', 'yellow', 'yellow', 'blue', 'blue', 'blue', 'yellow', 'yellow', 'blue',
       'blue', 'blue', 'blue', 'yellow', 'yellow', 'blue', 'yellow', 'yellow', 'yellow', 'blue', 'blue',
       'yellow', 'blue', 'blue', 'yellow', 'yellow', 'yellow', 'yellow', 'blue', 'blue', 'blue', 'yellow',
       'yellow', 'yellow', 'blue', 'blue', 'blue', 'yellow', 'blue'],
  "segment2": ['3','3', '2', '1', '0', '2', '1', '0', '2', '3', '0', '1', '2', '3', '0',
        '1', '1', '2', '1', '0', '3', '2', '3', '0', '0', '3', '2', '1', '0', '3', '2', '1', '2',
        '1', '0', '2', '1', '0', '3','3'],
  "topic": ['crop', 'crop', 'crop', 'crop', 'crop', 'crop', 'crop', 'crop',
       'disease', 'disease', 'disease', 'disease', 'disease', 'disease',
       'disease', 'disease', 'livestock', 'livestock', 'livestock',
       'livestock', 'livestock', 'livestock', 'livestock', 'livestock',
       'market', 'market', 'market', 'market', 'market', 'market',
       'market', 'market', 'seasonality', 'seasonality', 'seasonality',
       'seasonality', 'seasonality', 'seasonality', 'seasonality',
       'seasonality'],
  "pct": [0.32172903, 0.33498234, 0.34322452, 0.35243546, 0.35814752,
       0.32212135, 0.32747055, 0.33284846, 0.31116512, 0.30913507,
       0.29722269, 0.29622514, 0.29190591, 0.28912378, 0.30956642,
       0.31019998, 0.19642861, 0.16495416, 0.15154269, 0.14555771,
       0.2143507 , 0.20970412, 0.17562794, 0.19016186, 0.12147765,
       0.13316013, 0.13471437, 0.13386025, 0.13468065, 0.11940639,
       0.12020549, 0.12073481, 0.04594184, 0.05196162, 0.05204771,
       0.05606313, 0.0591409 , 0.05828934, 0.04709452, 0.0553901 ],
  "color": ['rgb(36, 121, 108)','rgb(36, 121, 108)', '#72B7B2', '#BAB0AC', '#4C78A8',
        '#72B7B2', '#BAB0AC', '#4C78A8', '#72B7B2', 'rgb(36, 121, 108)', '#4C78A8',
        '#BAB0AC', '#72B7B2', 'rgb(36, 121, 108)', '#4C78A8', '#BAB0AC', '#BAB0AC',
        '#72B7B2', '#BAB0AC', '#4C78A8', 'rgb(36, 121, 108)', '#72B7B2', 'rgb(36, 121, 108)',
        '#4C78A8', '#4C78A8', 'rgb(36, 121, 108)', '#72B7B2', '#BAB0AC', '#4C78A8', 'rgb(36, 121, 108)',
        '#72B7B2', '#BAB0AC', '#72B7B2', '#BAB0AC', '#4C78A8', '#72B7B2', '#BAB0AC', '#4C78A8',
        'rgb(36, 121, 108)', 'rgb(36, 121, 108)']
})
and my code as here:
bigfig = make_subplots(
    1, 2,
)

for idx, seg1 in enumerate(df["segment1"].unique()):
  df_sub_broad = df[df["segment1"]==seg1]

  bigfig.add_trace(
    go.Bar(
      x=df_sub_broad["topic"],
      y=df_sub_broad["pct"],
      showlegend=False,
      marker={
        "color": df_sub_broad["color"],
      },
      name="broad"
    ), row=1, col=idx+1
  )
with the added parameter:
bigfig.update_layout(barmode="stack")
and yet my graphs are grouped.
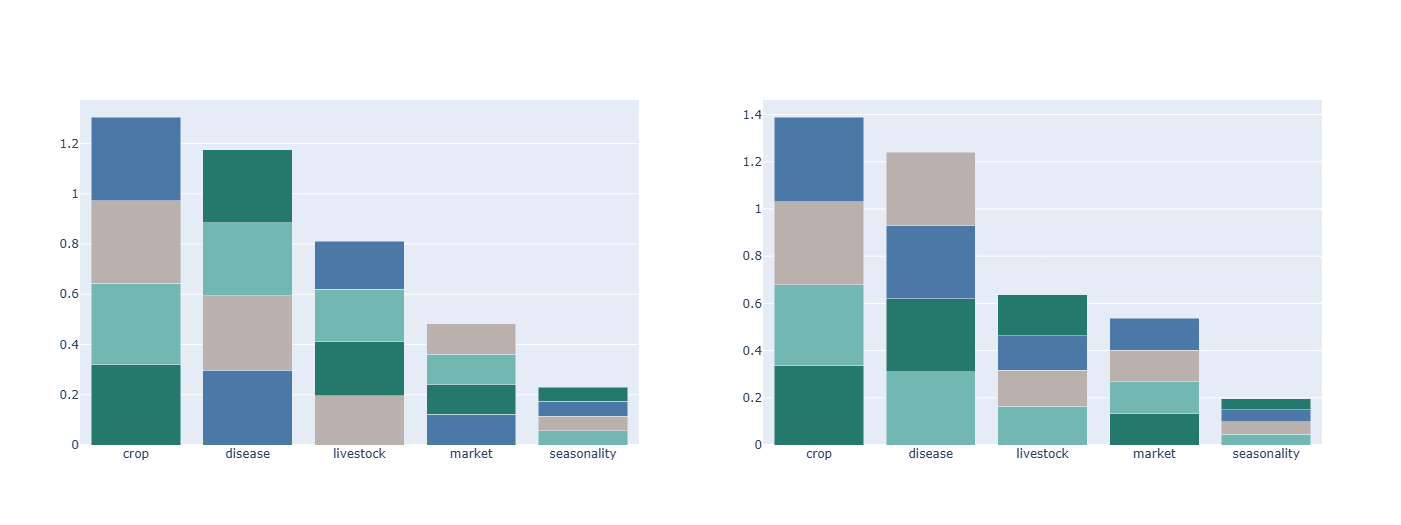
does anyone know a workaround for this?