Hi everyone!
I have a dataframe with the follow columns: ‘Ceará’, ‘Espírito Santo’, ‘Paraná’, ‘Minas Gerais’, ‘Rio de Janeiro’ and ‘São Paulo’.
I am ploting that using this code:
fig = make_subplots(specs=[[{“secondary_y”: True}]])
    for k in df_ufs.columns:
        fig.add_trace(
            go.Scatter(
                x=df_ufs.index,
                y=df_ufs[k],
                name=k,
                marker={'color': cls.colors[k]},
                text=df_ufs[k],
        ),
            secondary_y=True,
        )
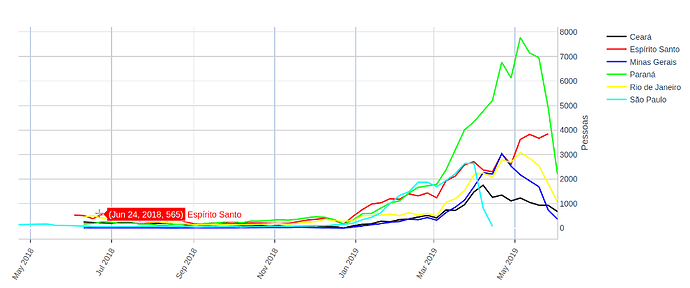
this is a snapshot of the chart:
Now I want the legend shows the information like:
Date:% d /% m /% Y
And the six states and their respective reported cases.
e.g:
My dataframe structure is df.info():
<class ‘pandas.core.frame.DataFrame’>
RangeIndex: 52 entries, 0 to 51
Data columns (total 6 columns):
Ceará 52 non-null object
Minas Gerais 52 non-null object
Rio de Janeiro 52 non-null object
São Paulo 52 non-null object
Espírito Santo 52 non-null object
Paraná 52 non-null object
dtypes: object(6)
memory usage: 2.6+ KB
I read the docs but I didn’t find anything similar. how can I do that? could everyone point me a doc page about that?
thanks

