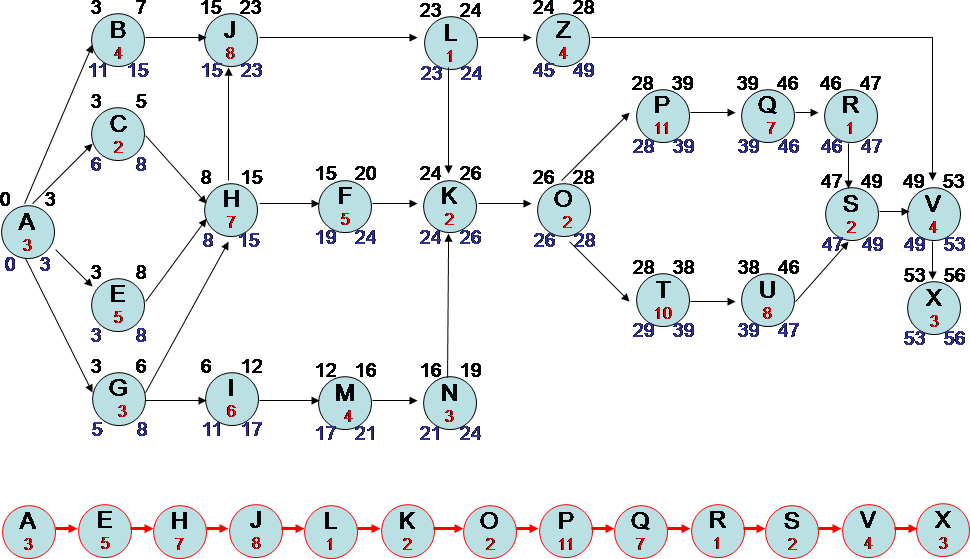
I planning to work on drawing a Network activity diagram for finding Critical Path. I have coded to console output but I need to make it as this picture http://www.codeproject.com/KB/recipes/CriticalPathMethod/CPMTestCase.png
Can anyone guide me what modules come in handy, as I am new to Plotly ?
Hi @nechiii,
I’d recommend you start by working through understanding this example: https://plot.ly/python/network-graphs/. This uses the networkX library to compute node / edge positions, then represents the notes as a scatter trace with mode='markers' and the edges with a scatter trace with mode='lines'.
If you’d like to add text labels to the nodes, then work through the examples here: https://plot.ly/python/text-and-annotations/
Hope that gets you started!
-Jon
1 Like
I tried using annotations ! Multiple directed nodes aren’t getting any arrows!
It would be helpful if you can just show an example.
Hi @nechiii,
Here’s a simple example of drawing a single arrow as an annotation.
from plotly.offline import iplot
import plotly.graph_objs as go

data = []

layout = go.Layout(
    showlegend=False,
    annotations=[
        dict(
            # Tip of the arrow
            x=1,
            y=1,

            # Tail of the arrow
            ax=2,
            ay=2,

            # Tell plotly to treat x/y/ax/ay as axis coordinates (not pixels)
            xref='x',
            yref='y',
            axref='x',
            ayref='y',

            # Arrow properties
            showarrow=True,
            arrowhead=2,
            arrowsize=1,
            arrowwidth=2,
            arrowcolor='#636363',
        )
    ]
)

fig = go.Figure(data=data, layout=layout)
iplot(fig)

I hope that’s helpful!
-Jon