Plotly express - hover/selecting event only partially working

Hi there,

First of all, I really want to thank the plotly team for their work and specially for the super cool plotly express tool! I is amazing :wink:

I am here just trying to get a subset of a Dataframe by lasso-selecting the data points on an ExpressFigure. it works well as long as there is only on trace but as soon as there are more I seems not to work. I can only retrieve data for one of the traces and the same seems to happen with a hover event. Additionally the indexes on match the index of the trace and not of the original DataFrame anymore.
It would be really helpful if someone could help out here?

Thanks folks

Greetings from a French guy in Austria ^^

here a short example:

import plotly_express as px
import plotly.graph_objs as go
import ipywidgets as widgets

iris = px.data.iris()

p = px.scatter(iris, x="sepal_width", y="sepal_length", color="species", hover_name=["petal_length","species"])

def hover_fn(trace, points, state):
    ind = points.point_inds[0]
    hover_data.value = 'hover_data: \n' + str(ind)
    
def selection_fn(trace, points, state):
    ind = points.point_inds
    selection_data.value = 'selection_data:\n' + str(ind)

selection_data = widgets.Textarea()  
hover_data = widgets.Textarea()  

fig  = go.FigureWidget(p)

for f in fig.data:
    f.on_hover(hover_fn)
    f.on_selection(selection_fn)

display(fig,widgets.HBox([selection_data, hover_data]))

Additionally I was trying to dynamically assign values to an ExpressFigure using ipywidgets :

import plotly_express as px
import plotly.graph_objs as go
import ipywidgets as widgets

iris = px.data.iris()
fig = go.FigureWidget()
keys= list(iris.keys()) 

@widgets.interact(x=keys, y=keys[::-1], color=[None]+keys, symbol=[None]+keys)
def update_px(x,y,color,symbol):
    p = px.scatter(iris, x, y, color, symbol, hover_name=["species"])
    for i in range(len(p.data)):
        fig.data = []
    fig.update(data = [d.to_plotly_json() for d in p.data])
    fig.plotly_relayout(p.layout.to_plotly_json())
    
fig

I was wondering if there is a more elegant way to do this? It would be really nice to be able to access px kwargs like for a FigureWidget. Something like:

p = px.scatter(iris, x, y, color, symbol)

p.color = 'petal_length'

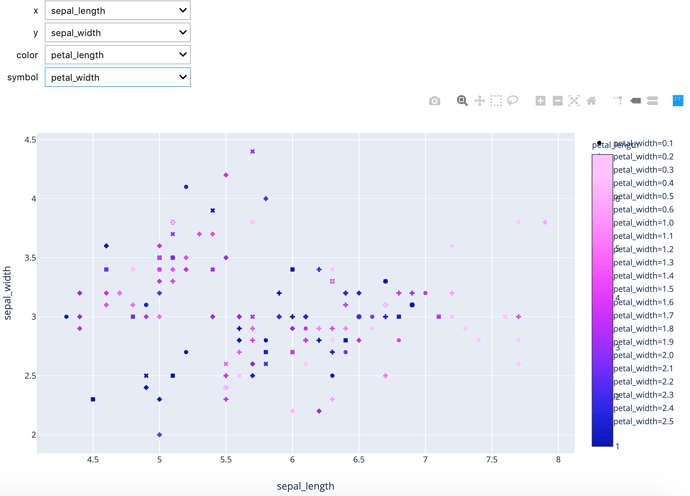
Finallly I noticed that in plotly express the colorbar and legend are overlapping:
Hi @Alexboiboi,

Glad you’re enjoying plotly_express! Also, thanks for helping people out on the forums here recently, very much appreciated :slightly_smiling_face:

One subtlety of the hover/selection callbacks when you have multiple traces in a figure is that a callback will be executed for each trace. So in your example, when you perform a lasso selection the callback is executed three times. Additionally, the callback will be executed with an empty points list for traces that don’t have any selected points.

So for hover callbacks, you generally want to filter out events with an empty points list. Something like:

def hover_fn(trace, points, state):
    if points.point_inds:
        ind = points.point_inds[0]
        hover_data.value = 'name:' + points.trace_name + ', hover_data: \n' + str(ind)

You’re right though that these indices are indices into the particular trace rather than indices into the original dataframe.

For updating the FigureWidget to match a new px figure, it would be nice to have something like a fig.react(new_fig) method that would completely replace the figure’s state with the new figure. I just opened an issue to discuss at https://github.com/plotly/plotly.py/issues/1521.

In the meantime, here’s what I do to replace the full contents of a figure.

fig.data = []
fig.add_traces(new_fig.data)
fig.layout = new_fig.layout

I think this will take care of your problem of ending up with both the legend and colorbar.

Hope that helps!
-Jon

Hi @jmmease, thanks for the helpful answer!

I found a work around to get the the dataframe index on hover by adding an index_new column to the dataframe and add this info to the hover_name property. I can then retrieve the hover data from the hover function as trace.hovertext[points.point_inds[0]]. It’s not very elegant but gets the job done.

Greetings, Alex

import plotly_express as px
import plotly.graph_objs as go
import ipywidgets as widgets

iris = px.data.iris()
iris['index_new'] = iris.index
p = px.scatter(iris, x="sepal_width", y="sepal_length", color="species", hover_name='index_new')

def hover_fn(trace, points, state):
    if points.point_inds:
        ind = points.point_inds[0]
        hover_data.value = 'hover_df_index: \n {:d}'.format(int(trace.hovertext[ind]))
        inds =  trace.hovertext[ind]
        display(iris[inds])

hover_data = widgets.Label()  

fig  = go.FigureWidget(p)

for f in fig.data:
    f.on_hover(hover_fn)

display(fig,hover_data)

So I’m working on adding a new hover_extra feature to Plotly Express to be able to add arbitrary columns to the hover label. This will work by putting arrays into customdata. I could make it such that customdata[0] is always the index of the point in the original data frame, for later retrieval, would that help?

Hi @nicolaskruchten, thanks I think it could help it deed :wink:

Cool. So how would you access it on hover if I put it into customdata[0] ?

Also i’ve logged a Github issue for the legend/colorbar thing: https://github.com/plotly/plotly_express/issues/54

In future, you should feel free to log Github issues for individual concerns, as that would really help me keep track of everything :stuck_out_tongue:

Upon further thought, I don’t think I should do anything special with dataframe index values and customdata[0], however you will be able to do your index_new trick with hover_extra (or hover_data as I will likely call it) instead of hover_name and it will be a little less inelegant in the hoverlabels.

Hi @jon and @nicolaskruchten,

just to say that I didn’t find any solution to make this work with an on_selection callback. the indexes are the right ones but I cannot select different traces in the same selection. It only takes into account the points which belong to the last point arriving in the selection lasso.
With on_hover it works nicely though.

Any solution there?

Thanks

-Alex

I don’t have an answer to your most recent question, sorry, but I came here to say that the most recent release of plotly_express lets you set hover_data=["col1", "col2", "col3"] which are then stored in customdata as an array, so you can use that for storing/retrieving IDs.

Hi @nicolaskruchten,

thanks for the effort on such a short time! Much appreciated !

Btw, I’m wondering how the selection works in plotly_express then, like when you use:

px.scatter_matrix(iris, dimensions=["sepal_width", "sepal_length", "petal_width", "petal_length"], color="species")```

The scatter_matrix uses the splom trace type with all the selection/brushing logic implemented in Javascript under the hood.