Plotly Dash stacked bar > 4 stacks [Python]

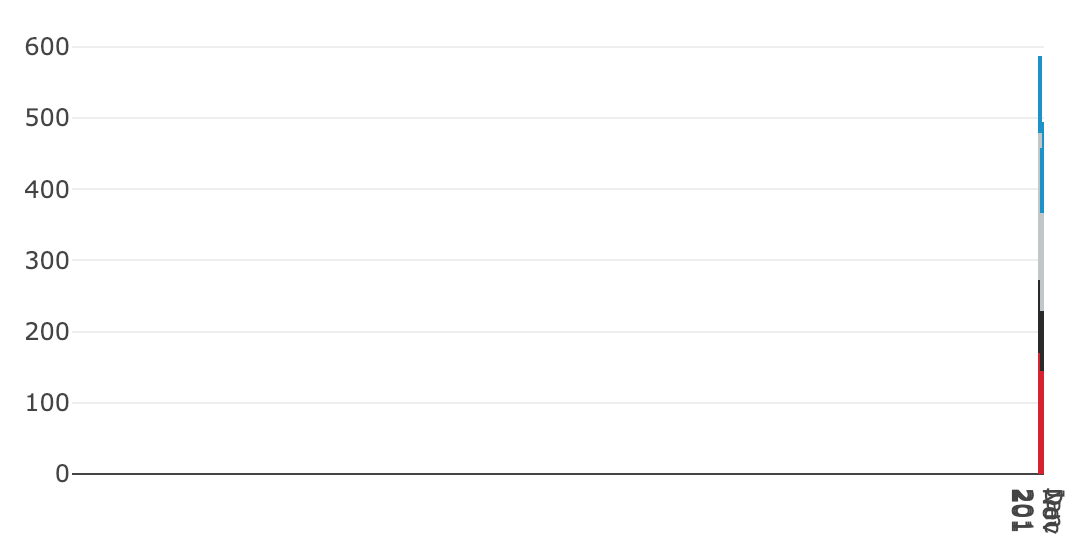
I am trying to create a Plotly Dash stacked graph. When I have more than four different bars in my stack, the graph becomes impossible to see. Here is my code…

 dcc.Graph(
   figure=go.Figure(
   data=[

    go.Bar(
        x=list(df.month.unique()),
        y=df.loc[df['location'] == 'Brn'].Talks,
        name='Brn',
        marker=go.bar.Marker(
            color='#da202a',
        )
    ),

    go.Bar(
        x=list(df.month.unique()),
        y=df.loc[df['location'] == 'Wrl'].Talks,
        name='Wrl',
        marker=go.bar.Marker(
            color='#2a2a2d',
        )
    ),

    go.Bar(
        x=list(df.month.unique()),
        y=df.loc[df['location'] == 'Lpl'].Talks,
        name='Lpl',
        marker=go.bar.Marker(
            color='#c1c6c8',
        )
    ),

    go.Bar(
        x=list(df.month.unique()),
        y=df.loc[df['location'] == 'HNE'].Talks,
        name='HNE',
        marker=go.bar.Marker(
            color='#0892cb',
        )
    ),
    layout=go.Layout(
    title='Conversation Required',
    showlegend=True,
    barmode='stack',
    xaxis = dict(tickvals=df.month.unique())
    ))

This is my code for creating the different stacks, however, when I want to add 5 or more stacks on the bar chart everything becomes impossible to see? Any help on how to fix this?

Not sure if this is the error but there’s data=[ in your code and I didn’t see the ] associate with it.
I can’t run your code since I don’t have your data but you can try mine which works fine creating >4 stacks:

import dash
import dash_core_components as dcc
import dash_html_components as html
import plotly.graph_objs as go

app = dash.Dash(__name__)

dates = ['2016-04-01', '2016-07-01', '2016-10-01']
trace1 = go.Bar(
    x=dates, y=[20, 14, 23],
    name='Brn'
)
trace2 = go.Bar(
    x=dates, y=[12, 18, 29],
    name='Wrl'
)
trace3 = go.Bar(
    x=dates, y=[20, 5, 12],
    name='Lpl'
)
trace4 = go.Bar(
    x=dates, y=[3, 18, 4],
    name='HNE'
)
trace5 = go.Bar(
    x=dates, y=[12, 3, 29],
    name='Zoo'
)

data = [trace1, trace2, trace3, trace4, trace5]
layout = go.Layout(
    barmode='stack',
    xaxis=dict(tickvals=['2016-04-01', '2016-07-01', '2016-10-01'])
)

fig = go.Figure(data=data, layout=layout)

app.layout = html.Div([
    html.Div(
        dcc.Graph(figure=fig)
    )
])

if __name__ == '__main__':
    app.run_server(debug=True)