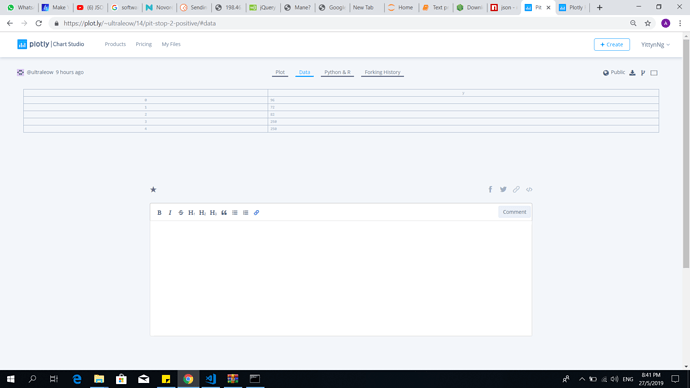
How can i change the axis scale ? I wanted the x value in the table on the most left, if i exclude the x column, the histogram will only plot the y value not the x.
Hi @aqiff12,
Perhaps you’re looking to use a bar trace rather than a histogram trace. bar is designed for cases where you already know the x-position and y-height of each bar. Histogram is designed for cases where you want plotly to compute the height of each bar by counting the number of data elements present in your dataset.
Hope that helps,
-Jon

