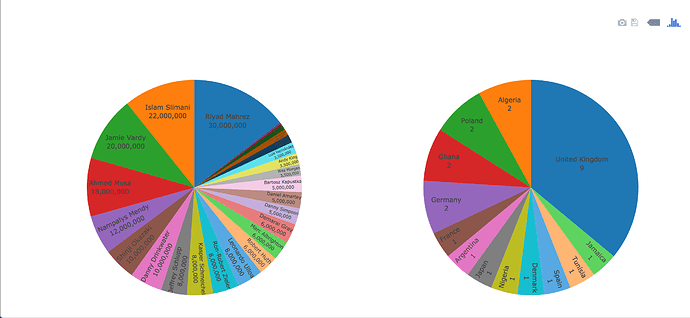
Hi, I’m new into visualisation and plotly. I successfully made my pie charts responsive but encountered a problem. The charts, when scalled down, are producing too much white space.
On desktop it is ok:
The problem occurs when it scales down, for example, mobile:
This is my code in javascript:
function drawPie() {
  var playersCountries = [],
      numPlayers = [],
      prev;
  countries.sort();
  for (var i = 0; i < countries.length; i++) {
      if (countries[i] !== prev) {
          playersCountries.push(countries[i]);
          numPlayers.push(1);
      } else {
          numPlayers[numPlayers.length - 1]++;
      }
      prev = countries[i];
  }
var d3 = Plotly.d3;
  var WIDTH_IN_PERCENT_OF_PARENT = 90,
      HEIGHT_IN_PERCENT_OF_PARENT = 90;
  var countryPie = d3.select("div[id='playerPie']")
      .style({
          width: WIDTH_IN_PERCENT_OF_PARENT + '%',
          'margin-left': (100 - WIDTH_IN_PERCENT_OF_PARENT) / 2 + '%',
          height: HEIGHT_IN_PERCENT_OF_PARENT + 'vh',
          'margin-top': (100 - HEIGHT_IN_PERCENT_OF_PARENT) / 2 + 'vh',
});
var countriesPie = countryPie.node();
  var infoValue = [{
    // showlegend:true,
    values: numPlayers,
    showlegend: false,
    legend: {"orientation": "h",
             "font":{
               "size:": 15
             }},
    labels: playersCountries,
    type: "pie",
    textinfo: "label+value",
    textposition: "inside",
  }];
  var playerPie = d3.select("div[id='countryPie']")
      .style({
          width: WIDTH_IN_PERCENT_OF_PARENT + '%',
          'margin-left': (100 - WIDTH_IN_PERCENT_OF_PARENT) / 2 + '%',
          height: HEIGHT_IN_PERCENT_OF_PARENT + 'vh',
          'margin-top': (100 - HEIGHT_IN_PERCENT_OF_PARENT) / 2 + 'vh',
});
var playersPie = playerPie.node();
  numbers = [];
  for (var i = 0; i<values.length; i++) {
    var currency = values[i];
    if (currency === null) {
      numbers.push(0);
    } else{
      var number = Number(currency.replace(/[^0-9\.]+/g,""));
      numbers.push(number);
    }
  };
  console.log(numbers);
  var piePlayers = [{
    // showlegend:false,
    values: numbers,
    showlegend: false,
    legend: {"orientation": "h",
             "font":{
               "size:": 15
             }},
    labels: names,
    type: "pie",
    textinfo: "label+value",
    textposition: "inside",
  }];
console.log(names);
  Plotly.newPlot(playersPie, piePlayers);
  window.addEventListener('resize', function() { Plotly.Plots.resize(playersPie); });
  Plotly.newPlot(countriesPie, infoValue);
  window.addEventListener('resize', function() { Plotly.Plots.resize(countriesPie); });
}
I tried to play around with different settings but nothing helps. I would really appreciate if anyone can tell what I am doing wrong. Thanks!


