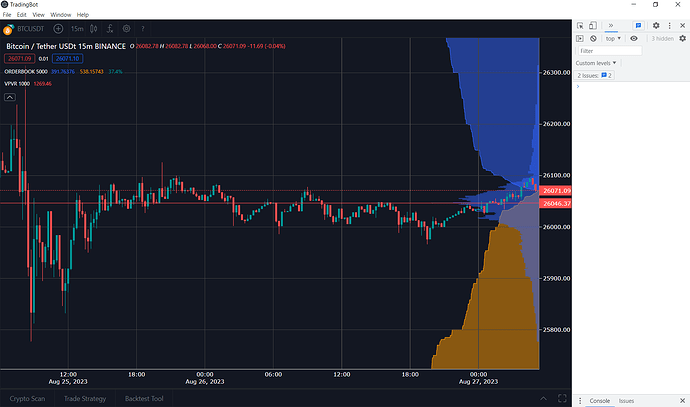
Solution:
As we create graphs with new axes, these are stacked, leaving the newest on top of the previous ones. If we have 3 graphs with different x-axes (xaxi, xaxis2 and xaxis3) and we create them in that order, then xaxis2 will be above xaxis and xaxis3 will be above xaxis and xaxis2, the number of the axis does not determine the order, this comes according to how we create the axes, that is, the xaxi3 axis could be created first and then the xaxis and finally the xaxis2 and in this way then xaxis would remain above xaxis3 and xaxis2 would be above xaxis3 and xaxis, plotly creates these graphs within tags that wrap all the traces of the graph these g elements are created in the order in which the axes were created and are identified with a class that bears the name of the axes with the number of the, if we consider the first case we would have the following tags in the following order
<g class='xy'></g>
<g class='x2y'></g>
<g class='x3y></g>
and the second case would be as follows
<g class='x3y'></g>
<g class='xy'></g>
<g class='x2y></g>
If they are ordered people, we would create the first graph on axis 1, that is, in xaxis and yaxis respectively, and the following ones would be created with consecutive numbers, that is, if we created a second graph with a new x axis, we would put it on xaxis2, but it would remain on top of the xaxis. first graph with xaxis 1; If we wanted to change that order, we would have to add the overlaying property to the x-axis of the first graph, indicating which axis the graph should be placed on, which in this case would be the x2 axis. Therefore, we would add overlaying=‘x2’ to xaxis, but what would happen? If we have more than one graph with different x-axes, at first I thought that if I set the overlay to a high xaxis, for example overlaying=‘x100’, I would be able to place xaxi 1 above all xaxis less than or equal to 100, but it doesn’t work like that In this case, only the graph that uses xaxis100 will be below xaxis 1 and from xaxis2 to xaxis99 will continue to be above
When we use overlaying the order of the elements changes, in the event that we create xaxis with overlaying=“x2” and then create xaxis2 the elements would look like this
> <g class='x2y'></g>
> <g class='xy'></g>
If later we add another graph in xaxis3 then it would look like this
<g class='x2y'></g>
<g class='xy'></g>
<g class='x3y'></g>
The xaxi3 is above xaxi and xaxi2 is below since the overlay was only applied to xaxi2
If we wanted to place xaxi above xaxi2 and xaxi3 we have two solutions, if you have fixed graphs, that is to say that you only create them once, then we would first create the graph that goes deeper, the one that we use xaxis3, then the graph that we use with xaxis2 and The last one was in xaxis, and since the name of xaxi is not the one that indicates the position of the graph, but the position depends on the order in which we created the graphs, then we could rename xaxis3 as xaxis and vice versa, example
We have a scatter in xaxi and it goes on top, we have a bar in xaxis2 and it goes to the bottom and we have an area in xaxis3 and it goes in the middle first we create the bar in xaxis2 and rename it to xaxis, then the area with xaxis3 and we rename it to xaxis2 and finally the scatter in xaxis and rename it to xaxis3
In my case, I have dynamic charts, that is, I can add or remove them at any time, the only fixed chart is the candlestick that cannot be removed and is in xaxis 1, and later you can select whether to add the orderbook or the vrvp and at any time. order, that is, I could add the vrvp first and then the orderbook or vice versa so that the first graph to be added would be assigned xaxis2 and the next one xaxis 3, if I later remove the vrvp in xaxis 2 then only the xaxis and y would remain the xaxis3 and if it occurs to me to add the vrvp again it would be added in the xaxis4, if later I delete both then only the xaxis would remain again and then I add again the orderbook assigns the xaxis2 again, as you can see the xaxis are dynamic and in this case the overlaying property that xaxi 1 has also has to be dynamic, that is, its value must be changed every time a new graphic is added, leaving something like this
Plotly.newPlot(layer, [{...}], {xaxis: {overlaying:false,...}, ...)
//we get the new available x-axis
const xaxi = getXaxi()
//create the new x axis and change the overlay with the new axis
Plotly.update(layer, {}, {
'xaxis.overlaying': `x${xaxi}`,
[`xaxis${xaxi}`]: {
...
})
//We add the new graph with the new x-axis
Plotly.addTraces(layer, [{
xaxis: `x${xaxi}`,
...
}])
In this way we achieve that the graph in xaxis is always above the others in other xaxis

