Overlapping graphs

Hi my code is below but it’s overlapping.

layout = html.Div([

        dcc.Checklist(
            id = 'clts',
            values=[],
            options=[
            ],
            labelStyle={'display': 'inline-block'},
            style={"height" : "3vh", "width" : "100vw"}
        ),

        html.Div([
            dcc.Graph(id='ts1', style={"height": "100vh", "width": "25vw","float": "left", 'display': 'inline-block'}),
            dcc.Graph(id='ts2', style={"height": "100vh", "width": "25vw","float": "left", 'display': 'inline-block'}),

            dcc.Graph(id='ts3', style={"height": "100vh", "width": "25vw", "float": "left", 'display': 'inline-block'}),
            dcc.Graph(id='ts4', style={"height": "100vh", "width": "25vw", "float": "left", 'display': 'inline-block'}),

        ], style={"height" : "97vh", "width" : "100vw"}),

        dcc.Interval(
            id='interval-component10',
            interval=10 * 1000  # in milliseconds
        )

    ]
)

How to fix it so the graphs don’t overlap?
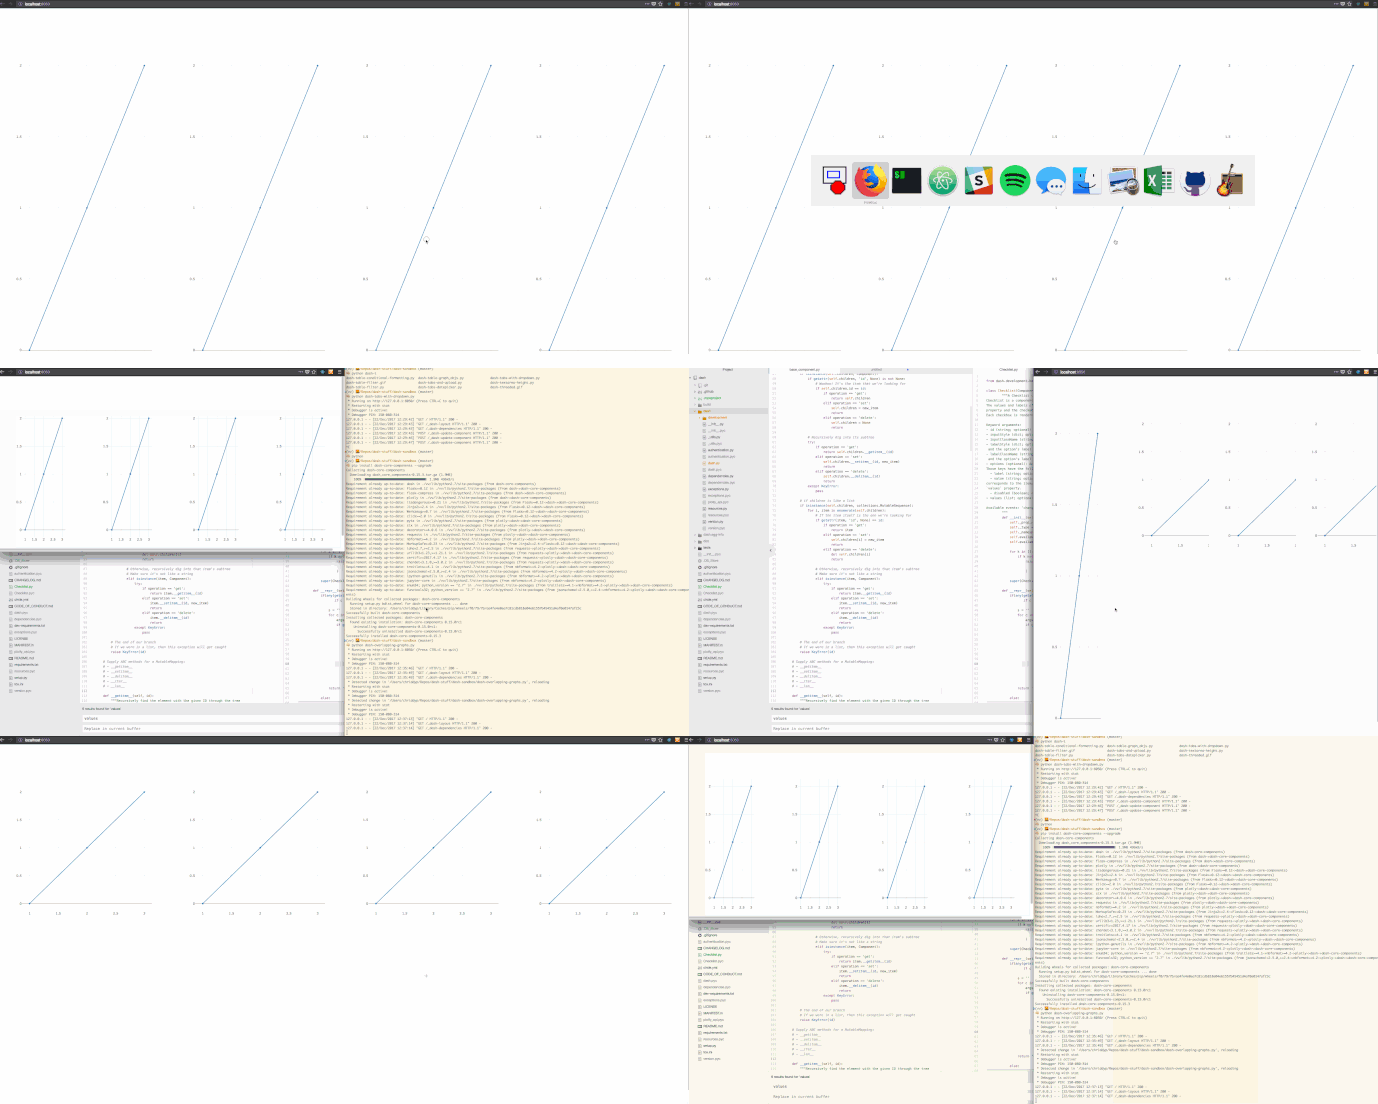
@dynamite - Hm, I’m not sure what’s going on here. I added some data to your examples and the graphs render fine for me. Can you try reproducing your issue by adding a figure property to the example above? Here is the example that I used:

import dash
import dash_core_components as dcc
import dash_html_components as html

app = dash.Dash()

app.layout = html.Div([

        dcc.Checklist(
            id = 'clts',
            values=[],
            options=[
            ],
            labelStyle={'display': 'inline-block'},
            style={"height" : "3vh", "width" : "100vw"}
        ),

        html.Div([
            dcc.Graph(
                figure={'data': [{'x': [1, 2, 3]}]},
                id='ts1',
                style={
                    "height": "100vh",
                    "width": "25vw",
                    "float": "left",
                    'display': 'inline-block'
                }
            ),
            dcc.Graph(
                figure={'data': [{'x': [1, 2, 3]}]},
                id='ts2',
                style={
                    "height": "100vh",
                    "width": "25vw",
                    "float": "left",
                    'display': 'inline-block'
                }
            ),

            dcc.Graph(
                figure={'data': [{'x': [1, 2, 3]}]},
                id='ts3',
                style={
                    "height": "100vh",
                    "width": "25vw",
                    "float": "left",
                    'display': 'inline-block'
                }
            ),
            dcc.Graph(
                figure={'data': [{'x': [1, 2, 3]}]},
                id='ts4',
                style={
                    "height": "100vh",
                    "width": "25vw",
                    "float": "left",
                    'display': 'inline-block'
                }
            ),

        ], style={"height" : "97vh", "width" : "100vw"}),

        dcc.Interval(
            id='interval-component10',
            interval=10 * 1000  # in milliseconds
        )

    ]
)

if __name__ == '__main__':
    app.run_server(debug=True)