Hi everyone. I am new to plotly.
I am trying to plot some points using longitude and latitude but it turns out that only the data in the last row of my dataframe will show up.
Here’s part of my code:
spot = [ dict(
	type = 'scattergeo',
	locationmode = 'country names',
	locations = ['CHINA'] * len(df['city']),
	lon = df['lon],
	lat = df['lat'],
	hoverinfo = 'text',
	text = df['city'],
	mode = 'markers',
	marker = dict(
		size=2,
		color='rgb(255, 0, 0)',
		line = dict(
			width=3,
			color='rgba(68, 68, 68, 0)'
		)
	))]

fig = dict( data=spot )
py.iplot( fig, filename='Temp CN' )
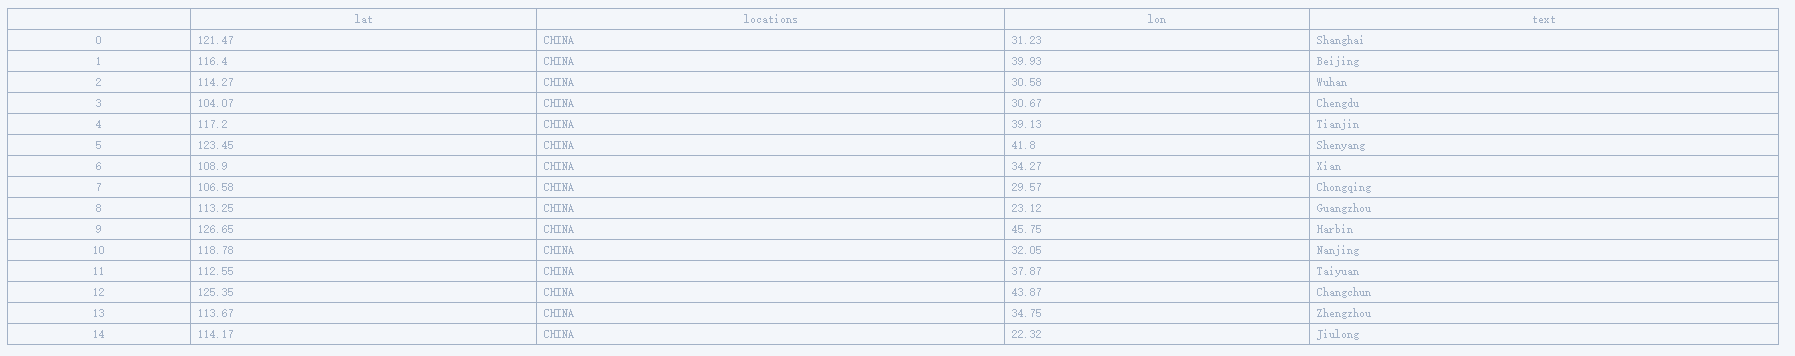
My data looks like this:
And here’s my graph:
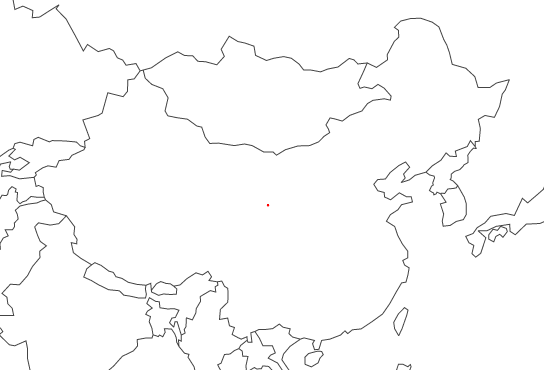
I am wondering what is wrong with my code.
Thank you all for your time!