Thats what i have:

Thats what i want:
@yuricda96 In the first image are those lines the gridlines or lines plotted by you in a separate trace? If they are gridlines, then you can remove them by updating fig.layout:
fig.update_layout(yaxis_showgrid = False, yaxis_zeroline=False)
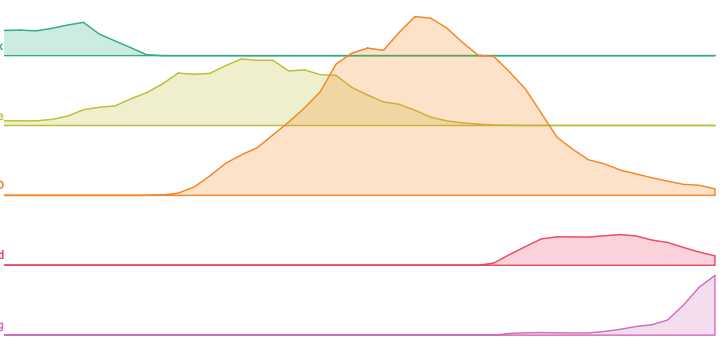
If this is the case you cannot replace the gray gridlines by multicolor gridlines, because
the yaxis_gridcolor accepts a single color, i.e. yaxis_gridcolor='#23a015'. I don’t understand why you need those lines because it is sufficient to plot the pdf of each data set only over its points, not extended at the plot ends.
If those line are plotted by you, then please explain how is defined the trace(s) that define them to see if it is possible or not to color them by a colorscale.