Not able to get 1 month bins in my histogram

Good morning. I’m looking for some help getting single month bins for a plot of credit/debits. I’ve tried to specify the month size bins in both the layout and within each trace and both options have the same result of more than 1 bin when there’s data from only 1 month in the dataset (for example). If I put data from four months, there are eight bins shown. The example below is from the 1 month of some demo data.

Here’s the layout JSON…

{
    "bargap": 0.05,
    "bargroupgap": 0.2,
    "barmode": "overlay",
    "title": {
        "text": "Some title"
    },
    "xaxis": {
        "title": {
            "text": "x-axis"
        },
        "type": "date",
        "dtick": "M1",
        "tickformat": "%b %Y"
    },
    "yaxis": {
        "title": {
            "text": "y-axis"
        }
    }
}

Here’s the demo data I’m using to test…

[
    {
        "x": [
            "2023-01-01",
            "2023-01-03",
            "2023-01-03",
            "2023-01-03",
            "2023-01-04",
            "2023-01-06",
            "2023-01-06",
            "2023-01-06",
            "2023-01-11",
            "2023-01-11",
            "2023-01-13",
            "2023-01-14",
            "2023-01-18",
            "2023-01-20",
            "2023-01-20",
            "2023-01-20",
            "2023-01-25",
            "2023-01-28",
            "2023-01-31",
            "2023-01-31",
            "2023-01-31",
            "2023-01-31"
        ],
        "y": [
            "800.00",
            "322.48",
            "4785.22",
            "114.25",
            "2500.00",
            "3500.00",
            "578.20",
            "0.00",
            "84.00",
            "205.56",
            "100.00",
            "500.00",
            "1274.00",
            "50.00",
            "50.00",
            "0.00",
            "4.95",
            "500.00",
            "0.00",
            "1400.00",
            "500.00",
            "0.00"
        ],
        "name": "credit",
        "type": "histogram",
        "histfunc": "sum",
        "opacity": 0.25,
        "marker": {
            "color": "red"
        }
    },
    {
        "x": [
            "2023-01-01",
            "2023-01-03",
            "2023-01-03",
            "2023-01-03",
            "2023-01-04",
            "2023-01-06",
            "2023-01-06",
            "2023-01-06",
            "2023-01-11",
            "2023-01-11",
            "2023-01-13",
            "2023-01-14",
            "2023-01-18",
            "2023-01-20",
            "2023-01-20",
            "2023-01-20",
            "2023-01-25",
            "2023-01-28",
            "2023-01-31",
            "2023-01-31",
            "2023-01-31",
            "2023-01-31"
        ],
        "y": [
            "0.00",
            "0.00",
            "0.00",
            "0.00",
            "0.00",
            "0.00",
            "0.00",
            "2949.15",
            "0.00",
            "0.00",
            "0.00",
            "0.00",
            "0.00",
            "0.00",
            "0.00",
            "1949.16",
            "0.00",
            "0.00",
            "2300.00",
            "0.00",
            "0.00",
            "701.01"
        ],
        "name": "debit",
        "type": "histogram",
        "histfunc": "sum",
        "opacity": 0.25,
        "marker": {
            "color": "green"
        }
    }
]

Here’s the result that I see from this…

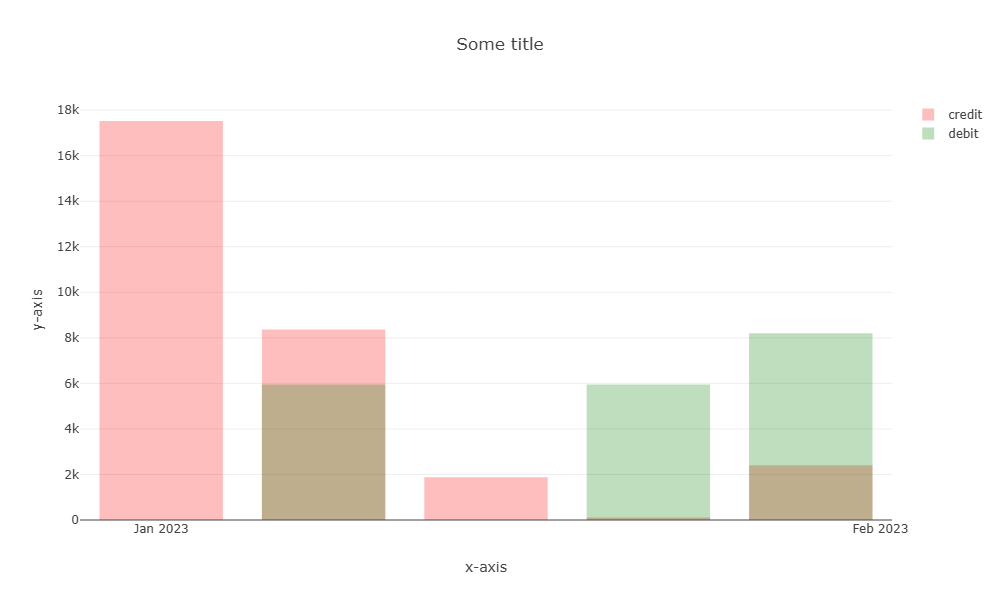
Any suggestions on what I’m doing wrong? I expect the above to show a single bin for January of 2023 while there are five bins showing.

Thanks,

Tom

For anyone looking for a solution, I managed to figure it out.

Add the “xbins” setting to the trace data. You can also add the '“ticklabelmode” = “period” to the layout to force the x-axis labels to be aligned to the bins.

[
    {
        "x": [
            "2023-01-01",
            "2023-01-03",
            "2023-01-03",
            "2023-01-03",
            "2023-01-04",
            "2023-01-06"
        ],
        "y": [
            "800.00",
            "322.48",
            "4785.22",
            "114.25",
            "2500.00",
            "3500.00"
        ],
        "name": "credit",
        "type": "histogram",
        "histfunc": "sum",
        "xbins": {
          size: 'M1' // 1 month bins
        },
        "opacity": 0.25,
        "marker": {
            "color": "red"
        }
    }
]