No Header in Dash

Dear all
I never have a header when i produce a dash table
Sorting, Filtering, Selecting, and Paging Natively | Dash for Python Documentation | Plotly

I used above demo file…I only see the row with the filters, but no header. Any idea where the problem is? Thanks for your help

hi @Marc_Ritzl
:wave: welcome to the community.

It’s hard to say without seeing you code. Can you please share with us?

Thx for the fast turn around. Neither the original dash demo code
Sorting, Filtering, Selecting, and Paging Natively | Dash for Python Documentation | Plotly.
shows a header, no my code:

import dash
from dash import dcc, html, dash_table, Input, Output, State
import pandas as pd
import plotly.express as px
from sqlalchemy import create_engine, inspect
from dash.exceptions import PreventUpdate

# Initialize database connection
engine = create_engine('sqlite:///portfolio.db')

# Function to check and initialize the database
header_row_inserted = False

def initialize_database():
    inspector = inspect(engine)
    if not inspector.has_table('portfolio'):  # Check if the 'portfolio' table exists
        # Create a DataFrame with the initial structure and dummy data
        df = pd.DataFrame({
            'Ticker': ['Dummy'],
            'Sector': ['Dummy'],
            'Asset Class': ['Dummy'],
            'Number': [0],  # Make sure this column exists with dummy data
            'Hist. Price': [0],
            'Hist Curr. Rate': [1],
            'Purchase Date': [pd.to_datetime('now')],
            'Currency': ['CHF'],
            'Acquisition Price in CHF': [0],  # This will be a calculated column
            'Cur Rate': [1],
            'Current Price': [0],
            'Current Value in CHF': [0],  # This will be a calculated column
            'Total G/V in CHF': [0],  # This will be a calculated column
            'G/V Curr %': [0],  # This will be a calculated column
            'G/V Asset in %': [0],  # This will be a calculated column
            'Total G/V in %': [0],  # This will be a calculated column
            '% der Position': [0],  # This will be a calculated column
            'Remarks': [''],
            'Country': ['Dummy'],
            'targetMeanPrice': [0],
            'quickRatio': [0],
            'dividendYield': [0],
            'debtToEquity': [0],
            'forwardEps': [0],
            'trailingEps': [0],
            'priceToBook': [0],
            'beta': [0],
            'pegRatio': [0]
        },  columns = [
            'Ticker', 'Sector', 'Asset Class', 'Number', 'Hist. Price', 'Hist Curr. Rate', 'Purchase Date', 'Currency',
            'Acquisition Price in CHF', 'Cur Rate', 'Current Price', 'Current Value in CHF', 'Total G/V in CHF',
            'G/V Curr %', 'G/V Asset in %', 'Total G/V in %', '% der Position', 'Remarks', 'Country',
            'targetMeanPrice', 'quickRatio', 'dividendYield', 'debtToEquity', 'forwardEps', 'trailingEps',
            'priceToBook', 'beta', 'pegRatio'
        ]
        )
        df.to_sql('portfolio', con=engine, index=False)

initialize_database()
# Function to load portfolio data from the database
def load_portfolio_data():
    df = pd.read_sql('portfolio', con=engine)
    if 'Number' in df and 'Hist. Price' in df and 'Hist Curr. Rate' in df:
        df['Number'] = pd.to_numeric(df['Number'], errors='coerce')
        df['Hist. Price'] = pd.to_numeric(df['Hist. Price'], errors='coerce')
        df['Hist Curr. Rate'] = pd.to_numeric(df['Hist Curr. Rate'], errors='coerce')
        df['Acquisition Price in CHF'] = df['Number'] * df['Hist. Price'] * df['Hist Curr. Rate']

        df['Current Price'] = pd.to_numeric(df['Current Price'], errors='coerce')
        df['Cur Rate'] = pd.to_numeric(df['Cur Rate'], errors='coerce')
        df['Current Value in CHF'] = df['Number'] * df['Current Price'] * df['Cur Rate']

        df['Current Price'] = pd.to_numeric(df['Current Price'], errors='coerce')
        df['Total G/V in CHF'] = pd.to_numeric(df['Total G/V in CHF'], errors='coerce')
        df['Total G/V in CHF'] = (df['Current Value in CHF'] - df['Acquisition Price in CHF'])


        df['G/V Curr %'] = (1- (df['Cur Rate'] / df['Hist Curr. Rate']))*100
        df['G/V Curr %'] = df['G/V Curr %'].round(2).astype(str) + '%'

        df['G/V Asset in %'] = pd.to_numeric(df['G/V Asset in %'], errors='coerce')
        df['G/V Asset in %'] = (df['Current Price'] / df['Hist. Price'])*100-100
        df['G/V Asset in %'] = df['G/V Asset in %'].round(2).astype(str) + '%'

        df['Total G/V in %'] = pd.to_numeric(df['Total G/V in %'], errors='coerce')
        df['Total G/V in %'] = df['Total G/V in CHF'] / df['Acquisition Price in CHF']*100
        df['Total G/V in %'] = df['Total G/V in %'].round(2).astype(str) + '%'

        df['% der Position'] = pd.to_numeric(df['% der Position'], errors='coerce')
        total_current_value_chf = df['Current Value in CHF'].sum()
        df['% der Position'] = (df['Current Value in CHF'] / total_current_value_chf)*100
        df['% der Position'] = df['% der Position'].round(2).astype(str) + '%'
        # Format numbers with ' sep. for database
        df['Total G/V in CHF'] = df['Total G/V in CHF'].apply(lambda x: f"{x:,.0f}")
        df['Acquisition Price in CHF'] = df['Acquisition Price in CHF'].apply(lambda x: f"{x:,.0f}")
        df['Current Value in CHF'] = df['Current Value in CHF'].apply(lambda x: f"{x:,.0f}")

        df.columns = [
            'Ticker', 'Sector', 'Asset Class', 'Number', 'Hist. Price', 'Hist Curr. Rate', 'Purchase Date', 'Currency',
            'Acquisition Price in CHF', 'Cur Rate', 'Current Price', 'Current Value in CHF', 'Total G/V in CHF',
            'G/V Curr %', 'G/V Asset in %', 'Total G/V in %', '% der Position', 'Remarks', 'Country',
            'targetMeanPrice', 'quickRatio', 'dividendYield', 'debtToEquity', 'forwardEps', 'trailingEps',
            'priceToBook', 'beta', 'pegRatio'
        ]

    return df

# Function to save portfolio data to the database
def save_portfolio_data(df):
    df.to_sql('portfolio', con=engine, if_exists='replace', index=False)

# Ensure the database is initialized
initialize_database()

# Load data from the database
df = load_portfolio_data()

# Generate pie charts using the loaded data
sector_fig = px.pie(df, names='Sector', title='Asset Allocation by Sector')
currency_fig = px.pie(df, names = "Currency", title="Asset Allocation by Currency")

# Separate header row and data rows
header_row = df.columns.tolist()
# data_rows = df.to_dict('records')

# Define card style
card_style = {
    'boxShadow': '2px 2px 2px lightgrey',
    'padding': '15px',
    'margin': '10px',
    'width': '40%',
    'display': 'inline-block',
    'backgroundColor': '#f9f9f9',
    'borderRadius': '5px',
}

app = dash.Dash(__name__, prevent_initial_callbacks = True)
# header_row = df.columns.tolist()
# data_rows = df.to_dict('records')

app.layout = html.Div([
    html.H1("Portfolio Manager"),
    dash_table.DataTable(
        id='portfolio-table',
        columns=[{'name': col, 'id': col, 'editable': (col not in ['Acqu. Price CHF', 'Current Value in CHF', 'Total G/V in CHF', 'G/V Curr %', 'G/V Asset in %', 'Total G/V in %', '% der Position'])} for col in header_row],
 #       data=data_rows,
        data=df.to_dict('records'),
        editable=True,
        row_deletable=True,
        row_selectable='multi',  # Enable multi-row selection
        column_selectable='multi',
        selected_rows=[],        # No rows selected by default
        selected_columns=[],
        filter_action="native",
        sort_action="native",
        sort_mode="multi",
        page_action="native",
        page_current=0,         # page number user is on
        page_size=10,           # number of rows visible per pge
        style_cell={'minWidth':50, ' maxWidth': 200},
        style_header={
            'backgroundColor': 'rgb(110, 110, 110)',
            'color': 'red',
            'fontWeight': 'bold',
            'textAlign': 'center',
            'border': '1px solid black'  # Add border to cells
        },
        style_data_conditional=[
            {'if': {'column_editable': True}, 'backgroundColor': 'orange', 'color': 'black'},
            {'if': {'column_editable': False}, 'backgroundColor': 'grey', 'color': 'white'},
        ],
        style_table={'marginLeft': '10px', 'overflowX': 'auto'},
 #       fixed_rows={'headers': True},
        fixed_rows={'headers': True, 'data': 0}

    ),
    # html.Button('Copy Selected Rows to Clipboard', id='copy-button', n_clicks=0),
    # dcc.Clipboard(target_id='output', title='copy', style={"position": "absolute", "top": 0, "right": 0}),
    html.Div(id='output', style={'white-space': 'pre-line'}),  # Hidden div to store the selected rows' string
    html.Button('Add Row', id='adding-row-button', n_clicks=0),
    html.Button('Save Changes', id='save-changes-button', n_clicks=0),

    html.Div([                                                                  # SECTOR PIE CHART
        dcc.Graph(id='sector-chart', style=card_style),
        dcc.Graph(id='currency-chart', style=card_style),
        ],                                                                                  # CURRENCY PIE CHART
    style={'display': 'flex', 'justifyContent': 'space-around'}),
])


@app.callback(
    Output('portfolio-table', 'data'),
    Output('portfolio-table', 'columns'),
    Output('sector-chart', 'figure'),
    Output('currency-chart', 'figure'),
    Input('adding-row-button', 'n_clicks'),
    Input('save-changes-button', 'n_clicks'),

    [State('portfolio-table', 'data'),
    State('portfolio-table', 'columns')],
)


def update_output(add_n_clicks, save_n_clicks, rows, columns):
    global header_row_inserted
    ctx = dash.callback_context
    if not ctx.triggered or not rows:
        raise PreventUpdate
    button_id = ctx.triggered[0]['prop_id'].split('.')[0]
    if button_id == 'adding-row-button':
        rows.append({col['id']: '' for col in columns})  # Add an empty row
    elif button_id == 'save-changes-button':
        new_df = pd.DataFrame(rows)
        save_portfolio_data(new_df)         # Save to database
        updated_df = load_portfolio_data()  # Reload data
        rows = updated_df.to_dict('records')
        columns = [{'name': col, 'id': col, 'editable': (col not in ['Acquisition Price in CHF', 'Current Value in CHF', 'Total G/V in CHF', 'G/V Curr %', 'G/V Asset in %', 'Total G/V in %', '% der Position'])} for col in updated_df.columns]

    if not header_row_inserted:
        header_row = [{'name': col, 'id': col, 'editable': (
                col not in ['Acquisition Price in CHF', 'Current Value in CHF', 'Total G/V in CHF', 'G/V Curr %',
                            'G/V Asset in %', 'Total G/V in %', '% der Position'])} for col in df.columns]
        rows.insert(0, {col['id']: col['name'] for col in header_row})
        header_row_inserted = True

    return rows, columns

if __name__ == '__main__':
    app.run_server(debug=True)

It might have something to do with the df. I ran your code but I get this error:

AttributeError: ‘Engine’ object has no attribute ‘cursor’

Can you please skip sqlite and just provide a csv sheet or a sample df that we can plug into the code your shared?

Dear Adam, sorry for the late replay, I was two days in a workshop.
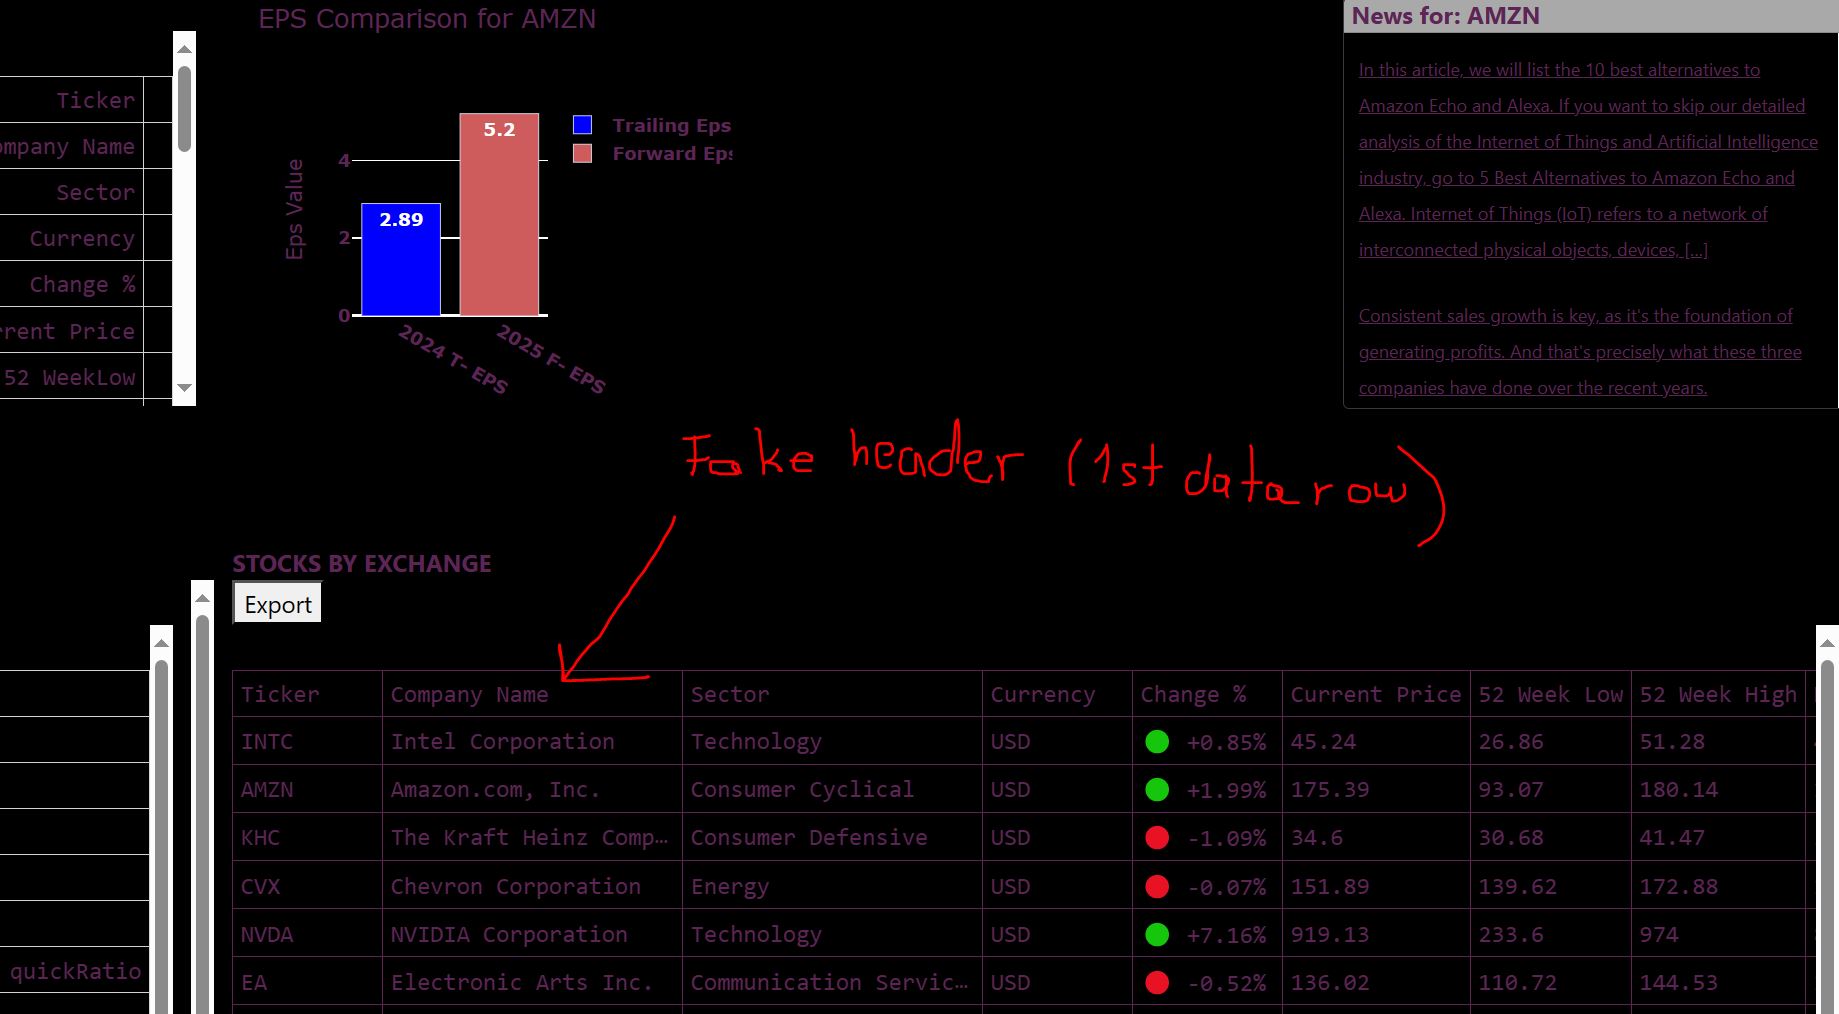
Attached please finde the CSV file with the “fake” header - i used 1st data row for that, which is suboptimal

I exported my dash table to a CSV, don’t see where I could upload it. Would you mind to share you email address with me?

Ticker,longName,sector,currency,change_in_p,currentPrice,fiftyTwoWeekLow,fiftyTwoWeekHigh,dayLow,dayHigh,targetHighPrice,targetMeanPrice,recommendationKey,recommendationMean,dividendRate,dividendYield,exDividendDate,quickRatio,trailingPE,debtToEquity,forwardEps,bookValue,priceToBook,beta,operatingMargins,marketCap,pegRatio,trailingEps
Ticker,Company Name,Sector,Currency, Change %,Current Price,52 Week Low,52 Week High,Day Low,Day High,Target High,Target Mean,Recommend.,Recom. Mean,Divid. Rate,Divid. Yield,Ex-Divid. Date,Quick Ratio,Trailing PE,Debt2Equity,Forward EPS,Book Value,Price2Book,Beta,Ops Margins,Market Cap in Mio,PEG Ratio,Trailing Eps
INTC,Intel Corporation,Technology,USD,:green_circle: +0.85%,45.24,26.86,51.28,44.46,45.265,68,44.59,hold,2.9,0.5,1.11%,06-02-2024,1.021,113.100006,45.226,2.24,24.974,1.811484,0.996,0.093660004,“191,275 Mio”,0.78,0.4
AMZN,“Amazon.com, Inc.”,Consumer Cyclical,USD,:green_circle: +1.99%,175.39,93.07,180.14,171.98,176.75,230,206.2,buy,1.7,0,0.00%,N/A,0.807,60.68858,80.037,5.2,19.443,9.020727,1.171,0.07525,“1,821,846 Mio”,2.6,2.89
KHC,The Kraft Heinz Company,Consumer Defensive,USD,:red_circle: -1.09%,34.6,30.68,41.47,34.57,34.91,45,39.11,buy,2.5,1.6,4.62%,07-03-2024,0.437,14.978354,41.296,3.21,40.662,0.8509173,0.666,0.19941999,“41,973 Mio”,2.71,2.31
CVX,Chevron Corporation,Energy,USD,:red_circle: -0.07%,151.89,139.62,172.88,150.79,152.57,196,177.44,buy,2.1,6.52,4.29%,15-02-2024,0.868,13.370599,16.1,14.69,86.274,1.7605535,1.118,0.105900005,“282,101 Mio”,-2.42,11.36
NVDA,NVIDIA Corporation,Technology,USD,:green_circle: +7.16%,919.13,233.6,974,861.73,919.6,1400,858.7,buy,1.7,0.16,0.02%,05-03-2024,3.385,76.91464,25.725,29.87,17.442,52.696365,1.725,0.61592996,“2,297,825 Mio”,0.97,11.95
EA,Electronic Arts Inc.,Communication Services,USD,:red_circle: -0.52%,136.02,110.72,144.53,135.65,137.4,165,151.56,buy,2.1,0.76,0.56%,27-02-2024,1.211,34.261967,29.431,7.6,28.088,4.8426375,0.767,0.18766001,“36,365 Mio”,1.65,3.97
PEP,“PepsiCo, Inc.”,Consumer Defensive,USD,:red_circle: -0.12%,164.54,155.83,196.88,163.96,165.42,210,186.78,buy,2.3,5.06,3.08%,29-02-2024,0.658,25.082315,252.514,8.83,13.467,12.218014,0.534,0.09828,“226,149 Mio”,2.88,6.56
IBM,International Business Machines Corporation,Technology,USD,:green_circle: +3.16%,197.78,120.55,199.18,192.15,199.18,215,183.41,hold,2.6,6.64,3.36%,08-02-2024,0.817,24.267487,265.047,10.65,24.626,8.031349,0.708,0.2317,“181,314 Mio”,3.73,8.15
META,“Meta Platforms, Inc.”,Communication Services,USD,:green_circle: +3.34%,499.75,190.84,523.57,484.79,502.31,575,504.54,buy,1.9,2,0.40%,21-02-2024,2.552,33.562794,24.76,22.99,59.808,8.355906,1.208,0.43710998,“1,274,068 Mio”,0.93,14.89
J,Jacobs Solutions Inc.,Industrials,USD,:green_circle: +0.90%,149.18,109,149.5,147.22,149.43,176,158,buy,1.9,1.16,0.78%,22-02-2024,1.322,26.591799,48.26,8.89,53.171,2.8056645,0.727,0.067,“18,745 Mio”,1.85,5.61
MRNA,“Moderna, Inc.”,Healthcare,USD,:red_circle: -1.38%,110.43,62.55,163.24,109.94,113.7,310,129.34,buy,2.5,0,0.00%,N/A,3.212,0,8.972,-4.97,36.267,3.044917,1.601,0.00213,“42,192 Mio”,0.31,-12.34

Dear Adam, I could solve it…it was a stupid CSS issue…

hi @Marc_Ritzl
Do you mind sharing the solution so other people can learn how to solve it if they come across the same issue?

Sure, but it is too embaressing, there was a statement in my css file, which disabeled the header :

.table-header {
display : none;
}

Von meinem/meiner Galaxy gesendet