Need help in Pie subplot chart

fig=make_subplots(rows=2, cols=2,subplot_titles=(‘Overall’,‘Ghotki’,‘Tando Mohammad Khan’),
specs=[[{‘type’:‘domain’}, {‘type’:‘domain’}], [{‘type’:‘domain’} , {‘type’:‘domain’}]])

fig.add_trace(go.Pie(labels=graph_lang.value_counts().index, values=graph_lang.value_counts(), name=‘Overall’,pull=[0.3, 0, 0.1, 0.1]), row=1,col=1)
fig.add_trace(go.Pie(labels=graph_lang1.value_counts().index, values=graph_lang1.value_counts().values, name=‘GHO’,pull=[0.1, 0.1, 0.2, 0]), row=1,col=2)
fig.add_trace(go.Pie(labels=graph_lang2.value_counts().index, values=graph_lang2.value_counts().values, name=‘TMK’,pull=[0, 0, 0.2, 0]), row=2,col=1)

fig.update_layout(title_text=“Usually speak language in Household”, title_x=0.5, title_y=0.95)
fig.update_layout(legend_title_text=‘Language Speak:’)
fig.update_layout(autosize=False, width=650, height=600)
fig.show()

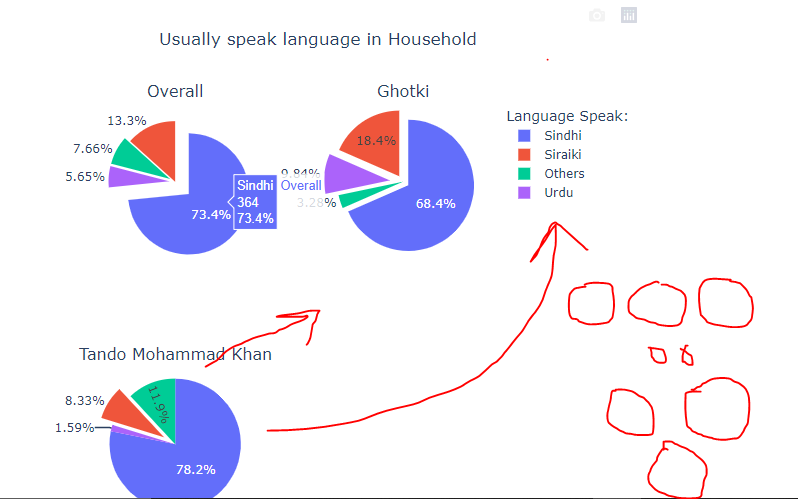
I want figure like triangle shape or side by side all figure show . . Anyone can help me out…
I really tired to solve this issues . . I can’t set domain values like what I want . .

Hi @Abbaxi123,
I don’t quite understand your question but assuming from the markings on your screenshot you are looking to align the subplots on a single row (side by side).
You can change the count of rows and cols in your make_subplots method. To keep all the pie charts on the same row and separate columns, rows=1 and cols=3 then set the respective row and col order in each of your add_trace

Modified code:

fig=make_subplots(rows=1, cols=3, subplot_titles=(‘Overall’,‘Ghotki’,‘Tando Mohammad Khan’),
specs=[[{‘type’:‘domain’}, {‘type’:‘domain’}], [{‘type’:‘domain’} , {‘type’:‘domain’}]])

fig.add_trace(go.Pie(labels=graph_lang.value_counts().index, values=graph_lang.value_counts(), name=‘Overall’,pull=[0.3, 0, 0.1, 0.1]), row=1,col=1)
fig.add_trace(go.Pie(labels=graph_lang1.value_counts().index, values=graph_lang1.value_counts().values, name=‘GHO’,pull=[0.1, 0.1, 0.2, 0]), row=1,col=2)
fig.add_trace(go.Pie(labels=graph_lang2.value_counts().index, values=graph_lang2.value_counts().values, name=‘TMK’,pull=[0, 0, 0.2, 0]), row=1,col=3)

fig.update_layout(title_text=“Usually speak language in Household”, title_x=0.5, title_y=0.95)
fig.update_layout(legend_title_text=‘Language Speak:’)
fig.update_layout(autosize=False, width=650, height=600)
fig.show()

No, the bad luck of doing all this is not happening like this and this error is being given.


The 'specs' argument to make_subplots must be a 2D list of dictionaries with dimensions (1 x 3).
 Received value of type <class 'list'>: [[{'type': 'domain'}, {'type': 'domain'}], [{'type': 'domain'}, {'type': 'domain'}]]

I want the pie chart to be like this 🔵🔵🔵 or like this 🔵🔵
                                                           🔵

@Abbaxi123 Sorry my bad, I forgot to change the specs list, below is the updated code:

fig=make_subplots(rows=1, cols=3, subplot_titles=(‘Overall’,‘Ghotki’,‘Tando Mohammad Khan’),
specs=[[{'type':'domain'}, {'type':'domain'}, {'type':'domain'}]])

fig.add_trace(go.Pie(labels=graph_lang.value_counts().index, values=graph_lang.value_counts(), name=‘Overall’,pull=[0.3, 0, 0.1, 0.1]), row=1,col=1)
fig.add_trace(go.Pie(labels=graph_lang1.value_counts().index, values=graph_lang1.value_counts().values, name=‘GHO’,pull=[0.1, 0.1, 0.2, 0]), row=1,col=2)
fig.add_trace(go.Pie(labels=graph_lang2.value_counts().index, values=graph_lang2.value_counts().values, name=‘TMK’,pull=[0, 0, 0.2, 0]), row=1,col=3)

fig.update_layout(title_text=“Usually speak language in Household”, title_x=0.5, title_y=0.95)
fig.update_layout(legend_title_text=‘Language Speak:’)
fig.update_layout(autosize=False, width=650, height=600)
fig.show()

I implemented what you sent but the result is here . …
i can’t handle the position .

This is R code . . I want it to be like this in python . . Check the domain

Brother thanks for replying to me… I am really glad.
I have done it … Hurray

1 Like