Hi all, I am trying to create a histogram where the x-axis changes depending on the column selected in the dataframe via a dropdown. This will be accompanied by a second dropdown that filters the column based on another variable (e.g. region). However, it seems to be unable to update the graph.
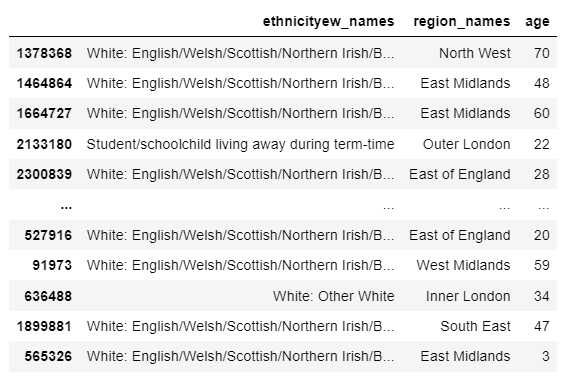

features = region_mirco_census.columns

app.layout = html.Div([
    html.Div([
        html.Div([
            dcc.Dropdown(
                id='slct_xaxis',
                options=[{'label': i, 'value': i} for i in features],
                value='ethnicityew_names',
                multi=True
            )
        ],
        style={'width': '48%', 'display': 'inline-block'}),

        html.Div([
            dcc.Dropdown(id="slct_location",
                 options=[{'label': i, 'value': i} for i in region_mirco_census['region_names'].unique()],
                    value='Inner London',
                )
        ],style={'width': '48%', 'float': 'right', 'display': 'inline-block'})
    ]),

    dcc.Graph(id='feature-graphic')
], style={'padding':10})

@app.callback(
    Output('feature-graphic', 'figure'),
    [Input('slct_xaxis', 'value'),
     Input('slct_location', 'value')])
def update_graph(slct_xaxis, slct_location):
    return {
        'data': [go.Histogram(
            x=region_mirco_census[slct_xaxis]
        )],
        'layout': go.Layout(
            xaxis={'title': 'xaxis_name'},
            yaxis={'title': 'yaxis_name'},
            margin={'l': 40, 'b': 40, 't': 10, 'r': 0},
            hovermode='closest'
        )
    }

if __name__ == '__main__':
    app.run_server(debug=False, port= 7222)
I have also tried a stripped down version with one dropdown to update a figure, with a similar result
features = region_mirco_census.columns

app.layout = html.Div([
    html.Div([
        html.Div([
            dcc.Dropdown(
                id='slct_xaxis',
                options=[{'label': i, 'value': i} for i in features],
                value='ethnicityew_names',
                multi=True)

    ]),

    dcc.Graph(id='feature-graphic')
], style={'padding':10})])

@app.callback(
    Output('feature-graphic', 'figure'),
    Input('slct_xaxis', 'value'))

def update_graph(slct_xaxis):

    fig = px.histogram(region_mirco_census, x=region_mirco_census[slct_xaxis])

    fig.update_layout(hovermode='closest')

    fig.update_xaxes(title='x')

    fig.update_yaxes(title='y')

    return fig

if __name__ == '__main__':
    app.run_server(debug=False, port= 7222)
