Multiple chart with a custom x axis position

I am putting together a chart with a scatter and bars:

Example

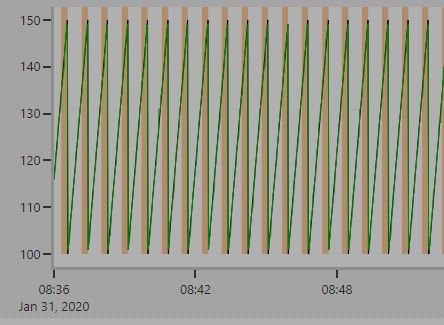
What I want is to start columns at non zero value. For that I am using the base property. However no x axis is shown. I need to draw it at the same value as the base. In my actual project things work like this. If I render it with yaxis.autorange = false then it looks like this:
Capture

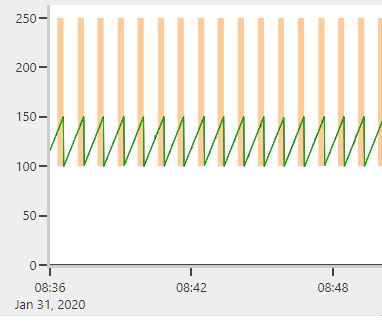
which is correct, but then doubleclick will kill it and it would look like this:
1

Please help. This is a critical matter.

Thanks

See

I think all you need is to disable the “autorange on doubleclick” behaviour. Setting doubleClick: 'reset' in the config (N.B. not the layout, the config) options should do the trick.

I already have doubleClick: ‘reset’ in my config. Plus, I do need to reset after the zoom. Please, give me more ideas, I am stuck.

BTW, would it help if I replace bars with filled areas?

Can you share a reproducible example of your graph to help us help you?

I am showing an example that is not working properly. No x axis is shown. Let’s start with that one.

Or like this one:
https://codepen.io/MZolotoy/pen/qBEzyRZ

Where is my x axis?