Hi All,
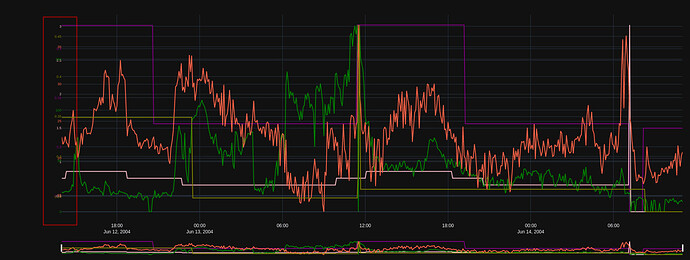
Is it possible to auto margin the multiple y axes during changing the window size? From the screenshot, we can see that the y-axes are not overlapping in full screen but the y-axes overlapping once I split screen.
Full Screen:
Split Screen:
This is my code:
import pandas as pd
import plotly
import plotly.graph_objects as go
import pytz
import datetime as dt

time_zone = pytz.timezone('Asia/Jakarta')
sensor_data_path = "/mnt/hgfs/FSD_Drive/Database/Database CSV File/" + "raw_data_testing.csv"
limit_data_path = "/mnt/hgfs/FSD_Drive/Database/Database CSV File/" + "limit_testing.csv"

# Read the CSV files (Sensor Data & Tag Limit)
df = pd.read_csv(sensor_data_path, parse_dates = ['Timestamp'])
limit = pd.read_csv(limit_data_path)
max_N_yaxis = 4

# Convert the timestamp to desired timezone
df['Timestamp'] = df['Timestamp'].dt.tz_localize(time_zone)
df.set_index('Timestamp', inplace=True)

# Function to plot the anomaly by adding limit data as optional arguments
def plot_anomaly(df, limit_data = None):

    # Plot the Graph if there has limit dataframe
    if limit_data is not None:

        fig = go.Figure()

        #Inputs for yaxis, marker color, axis name, low limit, high limit
        marker_color = ['#800080', '#ffc0cb', '#008000', '#ff6347', '#808000','#FFFF00','#0000FF', '#00FFFF', '#faebd7', '#f0ffff', '#deb887', '#7fff00', '#8fbc8f']
        axis_name = limit.tag_description.tolist()
        low_limit = limit.low_limit.tolist()
        high_limit = limit.high_limit.tolist()

        # Plot the Graph in For Loop
        for idx, col in enumerate (limit.tag_description, start = 0):
            fig.add_trace(go.Scatter(x = df.index, y = df.iloc[:, idx], mode = 'lines', name = col, yaxis = 'y'+str(idx+1), marker_color = marker_color[idx], marker_size=4, legendgroup = idx))
            # Plot the marker with low limit values
            fig.add_trace(go.Scatter(x = df.index, y = df.iloc[:, idx].where(df.iloc[:, idx] < low_limit[idx]), yaxis = 'y'+str(idx+1), mode = 'markers', marker_size=6, marker_symbol='cross', name = col, marker_color = 'red' , legendgroup = idx, showlegend=False, hoverinfo ="skip"))
            # Plot the marker with high limit values
            fig.add_trace(go.Scatter(x = df.index, y = df.iloc[:, idx].where(df.iloc[:, idx] >= high_limit[idx]), yaxis = 'y'+str(idx+1), mode = 'markers', marker_size=6, marker_symbol='cross', name = col, marker_color = 'red', legendgroup = idx, showlegend=False, hoverinfo ="skip" ))

        # Plot the Y-axes which less than or equal to max number yaxis
        if len(limit.tag_description) <= max_N_yaxis:
            domain = [len(limit.tag_description) *0.03, 1]
            axes = {'xaxis': dict(domain = domain)}
            # Plot the multiple Y axes in For Loop
            for i in range (1, len(limit.tag_description)+1):
                s = 'yaxis'
                y = 'y'
                if i == 1:
                    s = s
                    axes[s] = dict(
                        title = axis_name[i-1],
                        titlefont = dict(color = marker_color[i-1], size = 10),
                        tickfont = dict(color = marker_color[i-1], size = 10),
                        ticklabelmode = "period",
                        ticks = "inside",
                        tickson = 'boundaries',
                        automargin = True
                    )
                elif i > 1:
                    s = s +str(i)
                    axes[s] = dict(
                        title = axis_name[i-1],
                        titlefont = dict(color = marker_color[i-1], size = 10),
                        tickfont = dict(color = marker_color[i-1], size = 10),
                        ticklabelmode = "period",
                        ticks = "inside",
                        tickson = 'boundaries',
                        automargin = True
                    )
                    axes[s]["anchor"] = "free"
                    axes[s]["overlaying"] = y +str(i)
                    axes[s]["side"] = "left"
                    axes[s]["position"] = 0.03*i - 0.03
                    axes[s]["title"] = axis_name[i-1]

        # Plot the Y-axes which greater than max number yaxis
        elif len(limit.tag_description) > max_N_yaxis:
            domain = [len(limit.tag_description) *0.015 , 1]
            axes = {'xaxis': dict(domain = domain)}
            for i in range (1, len(limit.tag_description)+1):
                s = 'yaxis'
                y = 'y'
                if i == 1:
                    s = s
                    axes[s] = dict(
                        tickfont = dict(color = marker_color[i-1], size = 10),
                        ticks = "inside",
                        tickson = 'boundaries',
                        automargin = True
                        )
                elif i > 1:
                    s = s +str(i)
                    axes[s] = dict(
                        tickfont = dict(color = marker_color[i-1], size = 10),
                        ticks = "inside",
                        tickson = 'boundaries',
                        automargin = True
                    )
                    axes[s]["anchor"] = "free"
                    axes[s]["overlaying"] = y +str(i)
                    axes[s]["side"] = "left"
                    axes[s]["position"] = 0.015 * i - 0.015

        fig.update_layout(**axes)

    # Plot the Graph if there doesn't has limit dataframe
    else:

        fig = go.Figure()

        #Inputs for yaxis, marker color, axis name, low limit, high limit
        marker_color = ['#800080', '#ffc0cb', '#008000', '#ff6347', '#808000','#FFFF00','#0000FF', '#00FFFF', '#faebd7', '#f0ffff', '#deb887', '#7fff00', '#8fbc8f']
        axis_name = df.columns.tolist()

        # Plot the Graph in For Loop
        for idx, col in enumerate (df.columns, start = 0):
            fig.add_trace(go.Scatter(x = df.index, y = df.iloc[:, idx], mode = 'lines', name = col, yaxis = 'y'+str(idx+1), marker_color = marker_color[idx], marker_size=4, legendgroup = idx))

        # Plot the Y-axes which less than or equal to max number yaxis
        if len(df.columns) <= max_N_yaxis:
            domain = [len(df.columns) *0.03, 1]
            axes = {'xaxis': dict(domain = domain)}
            # Plot the multiple Y axes in For Loop
            for i in range (1, len(df.columns)+1):
                s = 'yaxis'
                y = 'y'
                if i == 1:
                    s = s
                    axes[s] = dict(
                        title = axis_name[i-1],
                        titlefont = dict(color = marker_color[i-1], size = 10),
                        tickfont = dict(color = marker_color[i-1], size = 10),
                        ticklabelmode = "period",
                        ticks = "inside",
                        tickson = 'boundaries',
                        automargin = True
                    )
                elif i > 1:
                    s = s +str(i)
                    axes[s] = dict(
                        title = axis_name[i-1],
                        titlefont = dict(color = marker_color[i-1], size = 10),
                        tickfont = dict(color = marker_color[i-1], size = 10),
                        ticklabelmode = "period",
                        ticks = "inside",
                        tickson = 'boundaries',
                        automargin = True
                    )
                    axes[s]["anchor"] = "free"
                    axes[s]["overlaying"] = y +str(i)
                    axes[s]["side"] = "left"
                    axes[s]["position"] = 0.03*i - 0.03
                    axes[s]["title"] = axis_name[i-1]

        # Plot the Y-axes which greater than max number yaxis
        elif len(df.columns) > max_N_yaxis:
            domain = [len(df.columns) *0.015 , 1]
            axes = {'xaxis': dict(domain = domain)}
            for i in range (1, len(df.columns)+1):
                s = 'yaxis'
                y = 'y'
                if i == 1:
                    s = s
                    axes[s] = dict(
                        tickfont = dict(color = marker_color[i-1], size = 10),
                        ticks = "inside",
                        tickson = 'boundaries',
                        automargin = True
                        )
                elif i > 1:
                    s = s +str(i)
                    axes[s] = dict(
                        tickfont = dict(color = marker_color[i-1], size = 10),
                        ticks = "inside",
                        tickson = 'boundaries',
                        automargin = True
                    )
                    axes[s]["anchor"] = "free"
                    axes[s]["overlaying"] = y +str(i)
                    axes[s]["side"] = "left"
                    axes[s]["position"] = 0.015 * i - 0.015

        fig.update_layout(**axes)

    # Add Rangeslider
    fig.update_layout(xaxis = dict(rangeslider=dict(visible=True), rangeslider_thickness = 0.06, type="date"))

    # Change the Layout's Theme and Legend's Orientation
    fig.update_layout(template = 'plotly_dark', legend=dict(orientation="h", yanchor = "bottom", y = -0.3), hovermode = "x")

    return fig.show(config= {'displaylogo': False})

plot_anomaly(df)
Seek for help urgenty.
Thank you.


