Hi,
This is my first time posting.
I’m trying to do the link below, but in one column and multiple rows.
https://plot.ly/~empet/14352/defining-subplots-with-two-y-axes-in-eac/#/
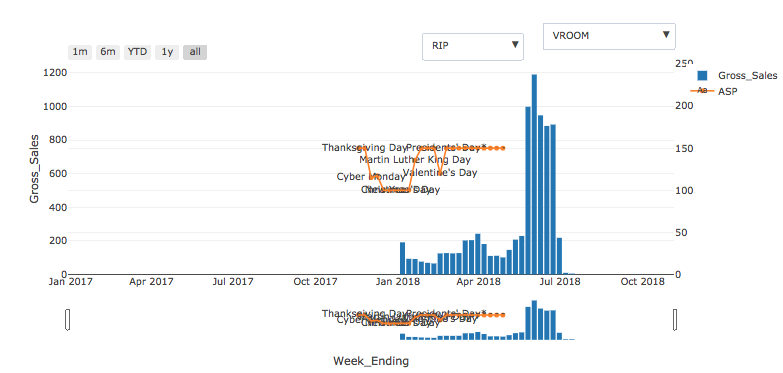
My challenge is that my data needs to use transforms because I want to aggregate it and filter it. I have been able to make it in one chart.
But when I try to do multiple charts using the plotly.make_subplots function, I get an error:
“ValueError: Invalid property specified for object of type plotly.graph_objs.Bar: ‘transforms’”
########################
CODE
########################
import pandas as pd
import numpy as np
import scipy as sp
import seaborn
import plotly
import plotly.plotly as py
import plotly.figure_factory as ff
import plotly.graph_objs as go
import pandas as pd
import matplotlib.pyplot as plt
import csv
import plotly.offline as off
from plotly.offline import init_notebook_mode, iplot, plot
from plotly import tools

plotly.tools.set_credentials_file(username='XXX', api_key='XXX')

off.init_notebook_mode(connected=False)

dp = pd.read_csv("FILEPATH")

dp['Week_Ending'] = pd.to_datetime(dp['Week_Ending'])
dp['Event_Description'] = dp['Event_Description'].astype(str)
dp[dp == 0] = np.nan
dp.sort_values(by=['Week_Ending','Customer'], ascending=True, na_position='first')

mylist = dp['Customer']
myset = set(mylist)
myNewList = list(myset)
aggs = myNewList
agg = []
agg_func = []
for i in range(0, len(aggs)):
    agg = dict(
        args=['transforms[0].value', aggs[i]],
        label=aggs[i],
        method='restyle'
        )
    agg_func.append(agg)

mylist2 = dp['Product_Type']
myset2 = set(mylist2)
myNewList2 = list(myset2)
aggs2 = myNewList2
agg2 = []
agg_func2 = []
for i in range(0, len(aggs2)):
    agg2 = dict(
        args=['transforms[1].value', aggs2[i]],
        label=aggs2[i],
        method='restyle'
    )
    agg_func2.append(agg2)


listTraces = {}
traceCount = 1
xCount = 1
yCount = 1
#for x in range(1,10):
for retail in aggs:
    newTrace = dict(
    #        listTraces["trace{0}".format(i)]=
    #        dict(
                x= dp['Week_Ending'],
                y= dp['Gross_Sales'],
                name= "Gross_Sales",
                text= dp['Event_Description'],
                type= "bar",
#                        xaxis= "x" + str(xCount),
#                        yaxis= "y" + str(yCount),
                transforms =
                    [
                    dict(
                        type = 'filter',
                        target = dp['Customer'],
                        orientation = '=',
                        value =  retail
                        ),
                    dict(
                        type = 'filter',
                        target = dp['Product_Type'],
                        orientation = '=',
                        value =  'HERO'
                        ),
                    dict(
                        type = "aggregate",
                        groups = dp['Week_Ending'],
                        aggregations =
                            [
                                dict(target = "y", func = "sum", enabled = True),
                            ]
                        )
                    ]
                )
#            )
    listTraces["trace{0}".format(traceCount)]=newTrace
    traceCount = traceCount+1
    yCount = yCount+1
    newTrace = dict(
#        listTraces["trace{0}".format(i)]=
#            dict(
                x= dp['Week_Ending'],
                y= dp['ASP'],
                name= "ASP",
                text= dp['Event_Description'],
                type= "scatter",
                mode= "lines+markers+text",
#               xaxis= "x" + str(xCount),
#               yaxis= "y" + str(yCount),
                connectgaps= True,
        #        zeroline= True,
        #        categorryarray= "column",
        #        categoryorder= "category ascending",
        #        mirror= True,
                transforms=
                    [
                    dict(
                        type = 'filter',
                        target = dp['Customer'],
                        orientation = '=',
                        value =  retail
                        ),
                    dict(
                        type = 'filter',
                        target = dp['Product_Type'],
                        orientation = '=',
                        value =  'HERO'
                        ),
                    dict(
                        type= "aggregate",
                        groups= dp['Week_Ending'],
                        aggregations =
                            [
                                dict(target = "y", func = "avg", enabled = True),
                            ]
                        )
                    ]
                )
#            )
    listTraces["trace{0}".format(traceCount)]=newTrace
    traceCount = traceCount+1
    xCount = xCount+1

layout = {"autosize": True, "hovermode": "closest", "showlegend": True}

rows=len(aggs)
fig = plotly.tools.make_subplots(rows=rows, cols=1, vertical_spacing=0.8/rows)

for i in range(1, len(listTraces) + 1):
    if i%2==1:
        fig.append_trace(listTraces["trace"+str(i)], i, 1)
    else:
        fig.append_trace(listTraces["trace"+str(i)], i-1, 1)

ySpace = 0.2
xStart = 0
xGap = 1
yStart = 0
yGap = 0.3
tNum = 1
for i in range(1, len(aggs) + 1):
    layout["xaxis"+str(i)]= dict(
        autorange= True,
        domain= [xStart, xStart+xGap],
        range= ["2018-05-08 12:00", "2018-08-07 12:00"],
        title= "Week_Ending",
        type= "date")
    layout["yaxis"+str(tNum)]= dict(
        autorange= True,
        title= "Gross_Sales",
        domain= [yStart, yStart+yGap],
        type= "linear")
    tNum = tNum + 1
    layout["yaxis"+str(tNum)]= dict(
        anchor= "x"+str(i),
        autorange= True,
        overlaying= "y"+str(tNum-1),
        domain= [yStart, yStart+yGap],
        side= "right",
        type= "linear")
    tNum = tNum + 1
    yStart = yGap+ySpace

updatemenus = list([
        #        dict(
        #            x = 0.75,
        #            y = 1.15,
        #            xref = 'paper',
        #            yref = 'paper',
        #            yanchor = 'top',
        #            active = 1,
        #            showactive = False,
        #            buttons = agg_func
        #            ),
                dict(
                    x = 1,
                    y = 1.15,
                    xref = 'paper',
                    yref = 'paper',
                    yanchor = 'top',
                    active = 1,
                    showactive = False,
                    buttons = agg_func2
                    )
                ]
            )

layout['updatemenus'] = updatemenus
fig['layout'] = layout

off.iplot(fig)
########################
Thanks for your help!
Luis