Hello @popo,
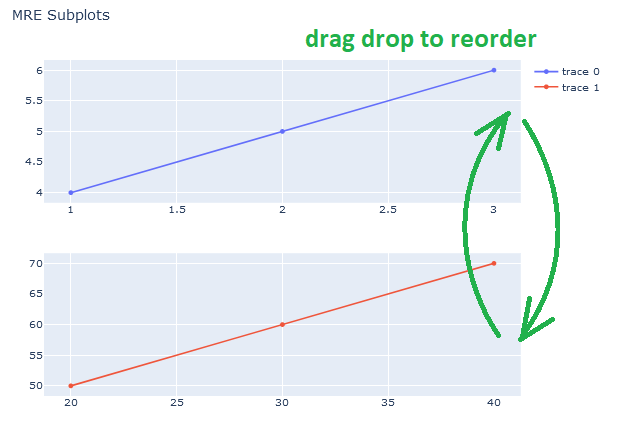
It took me some time, but I finally got something I think you’ll be happy with.  You can polish it however you want to, this is just a rough showing.

All of this is done on the client side, however… You can use the clientside to chain a callback to the server, easily.
Here is the .js file:
function coolEffects() {
    $(".modebar-group:first-of-type").prepend($('<button onclick=toggleEdit(this)>Testing</button>'))
}

var sp;
var oldDom;

function toggleEdit(el) {
    if (!$(el).closest('.dash-graph').hasClass('editing')) {
        plots = []
        jQuery.fn.reverse = [].reverse;
        function SortByTop(a, b){
              var top1 = a.getBoundingClientRect().top;
              var top2 = b.getBoundingClientRect().top;
              return ((top1 < top2) ? -1 : ((top1 > top2) ? 1 : 0));
            }
        $(el).closest('.dash-graph').find('.draglayer > g').sort(SortByTop).each(function (index) {
            plots.push($('<div class="dragula">' + this.classList + '</div>'))
            var parentPos = $(this).parent()[0].getBoundingClientRect(),
            childPos = this.getBoundingClientRect(),
            relativePos = {};

            relativePos.top = childPos.top - parentPos.top,
            relativePos.right = childPos.right - parentPos.right,
            relativePos.bottom = childPos.bottom - parentPos.bottom,
            relativePos.left = childPos.left - parentPos.left;


            $(plots[plots.length -1]).css(
                {'top': relativePos.top,
                'left': relativePos.left,
                'height': childPos.height,
                'width': childPos.width,
            })
        })

        $($(el).closest('.dash-graph').find('div')[0]).append(plots)
        drake = dragula([$(el).closest('.dash-graph').find('div')[0]])
        $('.dragula').each(function(index) { if (index != $('.dragula').length-1) {
            $(this).after($('<div class="divider"><div class="fa fa-bars"></div></div>'))}}
        )
        $(".divider").each(function () {
            dragElement(this)
        })
        drake.on('drop', function() {
            $('.divider').remove()
            $('.dragula').each(function(index) { if (index < $('.dragula').length-2) {
            $(this).after($('<div class="divider"><div class="fa fa-bars"></div></div>'))}})
            $(".divider").each(function () {
                dragElement(this)
            })
        })

    } else {
        $('#swap').click()
    }
    setTimeout(function () {
    $(el).closest('.dash-graph').toggleClass('editing')

    }, 1
    )
}

function dragElement(elmnt) {
  var pos1 = 0, pos2 = 0, pos3 = 0, pos4 = 0;
  elmnt.onmousedown = dragMouseDown;

  function dragMouseDown(e) {
    e = e || window.event;
    e.preventDefault();
    // get the mouse cursor position at startup:
    pos4 = e.clientY;
    document.onmouseup = closeDragElement;
    // call a function whenever the cursor moves:
    document.onmousemove = elementDrag;
  }

  function elementDrag(e) {
    e = e || window.event;
    e.preventDefault();
    pos2 = pos4 - e.clientY;
    pos4 = e.clientY;
    $(elmnt).prev()[0].style.height = parseFloat($(elmnt).prev()[0].style.height) - pos2 + 'px'
    $(elmnt).next()[0].style.height = parseFloat($(elmnt).next()[0].style.height) + pos2 + 'px'
  }

  function closeDragElement() {
    // stop moving when mouse button is released:
    document.onmouseup = null;
    document.onmousemove = null;
  }
}


window.fetch = new Proxy(window.fetch, {
    apply(fetch, that, args) {
        // Forward function call to the original fetch
        const result = fetch.apply(that, args);

        // Do whatever you want with the resulting Promise
        result.then((response) => {
            if (args[0] == '/_dash-update-component') {
                setTimeout(function() {coolEffects()}, 1000)
            }})
        return result
        }
    }
    )

$(document).ready(function() {
    setTimeout(function() {coolEffects()}, 1000)
})
Here is the app file:
import dash
from dash import dcc, html, Input, Output, State
from plotly.subplots import make_subplots
import plotly.graph_objects as go
import dash_bootstrap_components as dbc
from pprint import pprint

fig = make_subplots(rows=3, cols=1)

fig.add_trace(
    go.Scatter(x=[1, 2, 3], y=[4, 5, 6]),
    row=1, col=1
)

fig.add_trace(
    go.Scatter(x=[100, 200, 300], y=[400, 500, 600]),
    row=3, col=1
)

fig.add_trace(
    go.Scatter(x=[20, 30, 40], y=[50, 60, 70]),
    row=2, col=1
)
fig.update_layout(height=600, width=800, title_text="MRE Subplots")

app = dash.Dash(__name__,
                external_stylesheets = [dbc.themes.BOOTSTRAP, dbc.icons.FONT_AWESOME,
    "https://epsi95.github.io/dash-draggable-css-scipt/dragula.css"],
                external_scripts=[{'src':"https://ajax.googleapis.com/ajax/libs/jquery/3.6.0/jquery.min.js"},
                                 "https://cdnjs.cloudflare.com/ajax/libs/dragula/3.7.2/dragula.min.js",
                               "https://epsi95.github.io/dash-draggable-css-scipt/script.js"
])

app.layout = html.Div([
    html.Button('swap', id='swap'),
    dcc.Graph(figure=fig, id='myFig')
])

app.clientside_callback(
    """
        function (n, f) {
            newFig = JSON.parse(JSON.stringify(f))
            console.log(f.layout)
            dragEls = $('.dragula')

            l = $('.editing .draglayer > g')
            if (!sp) {
                sp = Math.abs(f.layout.yaxis.domain[0] - f.layout.yaxis2.domain[1])
            }

            if (dragEls[0]) {
                newLayout = JSON.parse(JSON.stringify(f.layout))
                ht = 0
                try {
                    $('.dragula').each( function () { ht += parseFloat(this.style.height)})
                    ht += sp*(dragEls.length-1)
                } catch {}
                for (y=0; y<dragEls.length; y++) {
                    per = parseFloat(dragEls[y].style.height) / ht

                    if ($(dragEls[y]).text() == 'xy') {
                        ref = ''
                    } else {
                        ref = $(dragEls[y]).text().split('y')[0].split('x')[1]
                    }
                    if (y==0) {
                        newLayout['yaxis'+ref] = f.layout['yaxis'+ref]
                        newLayout['yaxis'+ref].domain = [1-per+(sp/2), 1]
                        oldDom = 1 - per
                    }
                    else {
                        newLayout['yaxis'+ref] = f.layout['yaxis'+ref]
                        if ((oldDom - per+(sp/2)) < 0) {
                            newLayout['yaxis'+ref].domain = [0, oldDom]
                        } else {
                            newLayout['yaxis'+ref].domain = [oldDom - per+(sp/2), oldDom]
                        }
                        oldDom = oldDom - per

                    }
                }
                newFig.layout = newLayout
                try {
                    setTimeout(function() {
                    drake.destroy()}, 500)
                } catch {}
                $($('.editing').find('div')[0]).empty()
                console.log(newLayout)
            }
            return JSON.parse(JSON.stringify(newFig))
        }
    """,
    Output('myFig','figure'),
    Input("swap", "n_clicks"),
    State('myFig', 'figure'),
    prevent_intial_call=True
)

app.run_server(debug=True)
css file:
.editing .main-svg {
    visibility: hidden;
}

.editing > div:first-child {
    position: absolute;
    height: 100%;
    width: 100%;
    z-index: 1;
}

.editing .modebar-container {
    z-index: 2;
}

.dragula {
    background-color: silver;
    color: white;
    font-size: 20pt;
    font-weight: heavy;
    display: flex;
    align-items: center;
    justify-content: center;
    border: 1pt dashed black;
    margin: 2px;
    cursor: grab;
}

.divider {
    box-shadow: inset 0px 0px 5px silver;
    height: 10px;
    width: 100%;
    cursor: grab;
    display: flex;
    align-items: center;
    justify-content: center;
}
Unfortunately, with this style of callback , you wont be able to individually update the figure if needed from the server, other than through controlling all the children of the page, or what not.