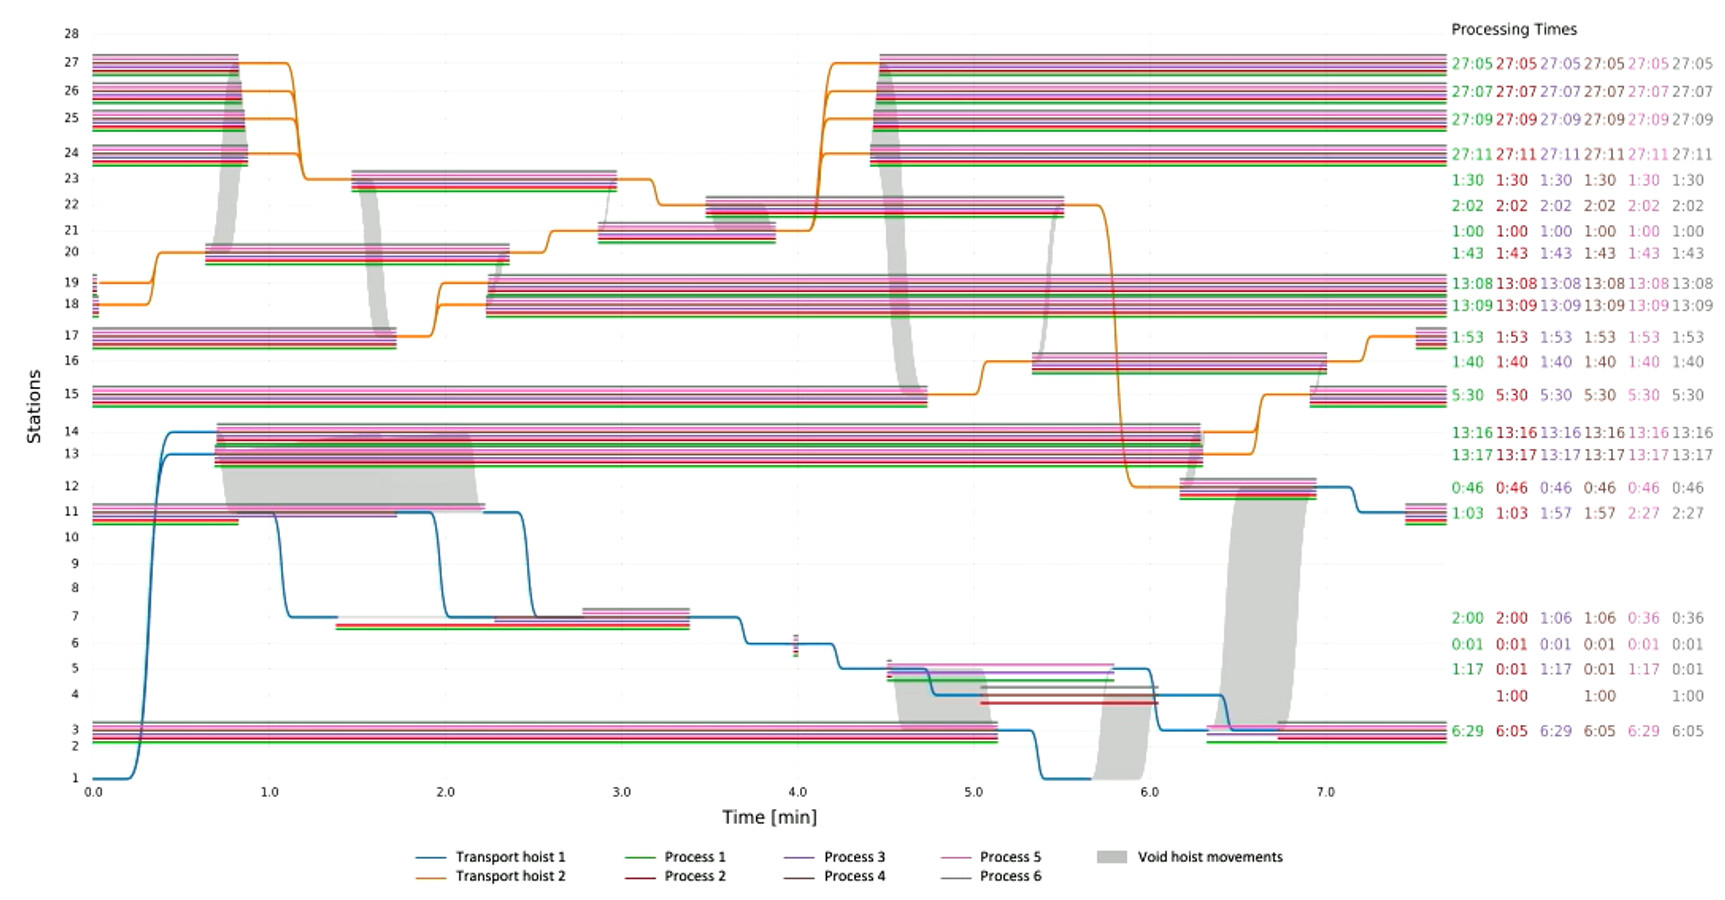
Does anyone know this type of diagram? For me, it looks like a mixture of a Sankey and a Gantt diagram.
More interestingly though, does anyone have any ideas or tips on how I can create such a chart with plotly? At least a similar chart would already be great.
I honestly don’t know the name of the diagram but it looks that it could maybe be done by adapting a line chart + some shapes? Have you tried that? Or do you have some sample data to run some tests?