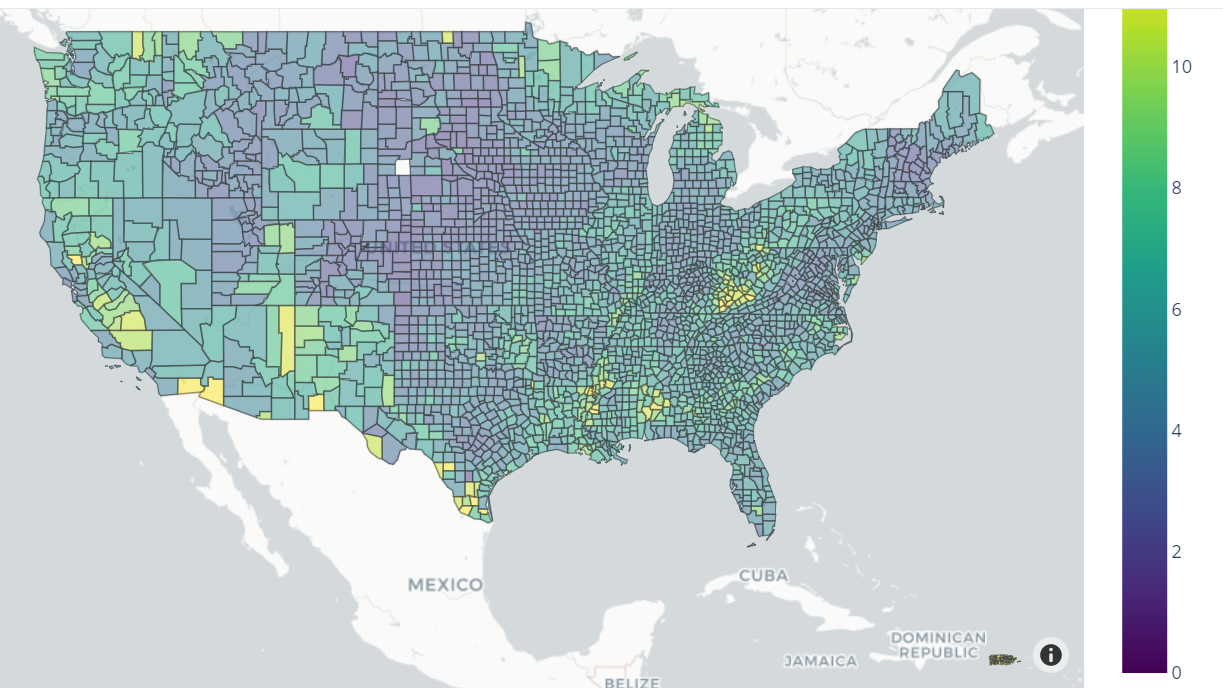
I everybody, I have a question . I created mapbox with tutorial in plotly.com. It show map not correctly .
I hope everybody can help me. Thanks so much.
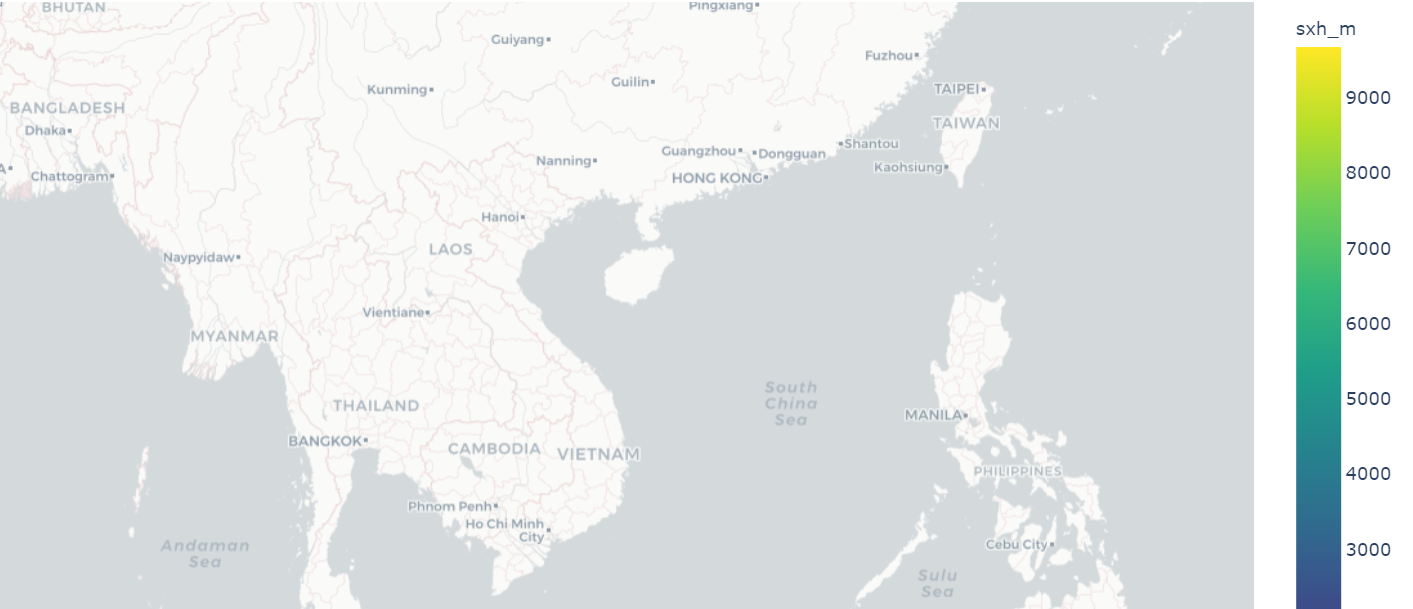
I everybody, I have a question . I created mapbox with tutorial in plotly.com. It show map not correctly .
Please when you need help try to provide your code so that we can see what you are doing…
import plotly.express as px
fig = px.choropleth_mapbox(data, locations=‘province’, geojson=vn_json,color=‘sxh_m’,
color_continuous_scale=“Viridis”,
mapbox_style=“carto-positron”,
zoom=4.0,
center = {“lat”: 16.4, “lon”: 107.683333333333},
opacity=0.5,
labels={‘name’:‘influenza rate’},
featureidkey=‘feature.properties.name’
)
fig.update_layout(margin={“r”:0,“t”:0,“l”:0,“b”:0})
fig.show()
How do you want your map to show like?