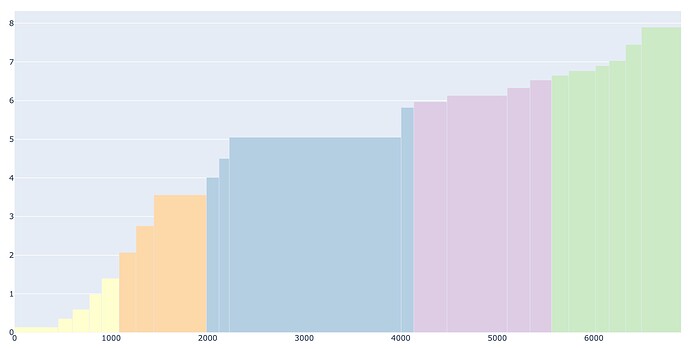
I have the two following codes with their output. One is done in graph objects and the other using plotly express. As you can see, the one in ‘go’ doesn’t have a legend, and the one in ‘px’ doesn’t have individual column width. So how can I either get a legend for the first one, or fix the width in the other?
import plotly.graph_objects as go
import pandas as pd

df = pd.DataFrame({'PHA': [451, 149, 174, 128, 181, 175, 184, 545, 131, 106, 1780, 131, 344, 624, 236, 224, 178, 277, 141, 171, 164, 410],
                   'PHA_cum': [451, 600, 774, 902, 1083, 1258, 1442, 1987, 2118, 2224, 4004, 4135, 4479, 5103, 5339, 5563, 5741, 6018, 6159, 6330, 6494, 6904],
                   'trans_cost_cum': [0.14, 0.36, 0.6, 0.99, 1.4, 2.07, 2.76, 3.56, 4.01, 4.5, 5.05, 5.82, 5.97, 6.13, 6.33, 6.53, 6.65, 6.77, 6.9, 7.03, 7.45, 7.9],
                   'Province': ['East', 'East', 'East', 'East', 'East', 'Lapland', 'Lapland', 'Lapland', 'Oulu', 'Oulu', 'Oulu', 'Oulu', 'South', 'South', 'South', 'South', 'West', 'West', 'West', 'West', 'West', 'West'],
                   })

col_list = {'South': 'rgb(222,203,228)',
            'West': 'rgb(204,235,197)',
            'East': 'rgb(255,255,204)',
            'Oulu': 'rgb(179,205,227)',
            'Lapland': 'rgb(254,217,166)'}

provs = df['Province'].to_list()

colors = [col_list.get(item, item) for item in provs]

fig = go.Figure(data=[go.Bar(
    x=df['PHA_cum']-df['PHA']/2,
    y=df['trans_cost_cum'],
    width=df['PHA'],
    marker_color=colors
)])

fig.show()
import plotly.express as px
import pandas as pd

df = pd.DataFrame({'PHA': [451, 149, 174, 128, 181, 175, 184, 545, 131, 106, 1780, 131, 344, 624, 236, 224, 178, 277, 141, 171, 164, 410],
                   'PHA_cum': [451, 600, 774, 902, 1083, 1258, 1442, 1987, 2118, 2224, 4004, 4135, 4479, 5103, 5339, 5563, 5741, 6018, 6159, 6330, 6494, 6904],
                   'trans_cost_cum': [0.14, 0.36, 0.6, 0.99, 1.4, 2.07, 2.76, 3.56, 4.01, 4.5, 5.05, 5.82, 5.97, 6.13, 6.33, 6.53, 6.65, 6.77, 6.9, 7.03, 7.45, 7.9],
                   'Province': ['East', 'East', 'East', 'East', 'East', 'Lapland', 'Lapland', 'Lapland', 'Oulu', 'Oulu', 'Oulu', 'Oulu', 'South', 'South', 'South', 'South', 'West', 'West', 'West', 'West', 'West', 'West'],
                   })

fig = px.bar(df,
             x=df['PHA_cum']-df['PHA']/2,
             y=df['trans_cost_cum'],
             color="Province",
             color_discrete_sequence=px.colors.qualitative.Pastel1
             )
fig.show()

