Live update with dataframe from SQL statement

Hi Guys, im trying to make my dashboard live, but i have some issues.

#get data from a Mysql and load like a dataframe
df = blackbootle.select_dashboard_view().array_from_Mysql()

This is my code:

import dash
import dash_core_components as dcc
import dash_html_components as html
import blackbootle
from dash.dependencies import Input, Output

app = dash.Dash()

def get_value():
    df = blackbootle.select_dashboard_view().array_from_Mysql()
    return df

print(get_value())

def serve_layout():
    return html.Div(children=[
        html.H4(children='Dashboard'),
        html.Div(id='my-id', children='''Events'''),
        dcc.Graph(id='example-graph', animate=True,
                  figure={'data': [
                      {'x': get_value().Hora, 'y': get_value().y, 'type': 'line', 'name': 'Mobile'},
                      {'x': get_value().Hora, 'y': get_value().x, 'type': 'line', 'name': 'Desktop'},

                  ],
                      'layout': {'title': 'Logins Por hora'}
                  }
                  ),
            dcc.Interval(
            id='interval-component',
            interval=5 * 1000,
            n_intervals=0  # in milliseconds
        ),
            ], )


app.layout = serve_layout

@app.callback(
    Output('example-graph','figure'),
    [Input('interval-component', 'n_intervals')])
def update_graph():
    return get_value()

if __name__ == '__main__':
    app.run_server(debug=False)

i got this error:

output_value = func(*args, **kwargs) # %% callback invoked %%
TypeError: update_graph() takes 0 positional arguments but 1 was given
127.0.0.1 - - [13/Feb/2020 13:53:33] “POST /_dash-update-component HTTP/1.1” 500 -
[2020-02-13 13:53:38,444] ERROR in app: Exception on /_dash-update-component [POST]

the dashboard is working in this way, but i want to tranforme him in a live update.
I tryed to adjuste the callback function, but didint work.

Someone has some tips to help me?

Thanks.

static dashboard
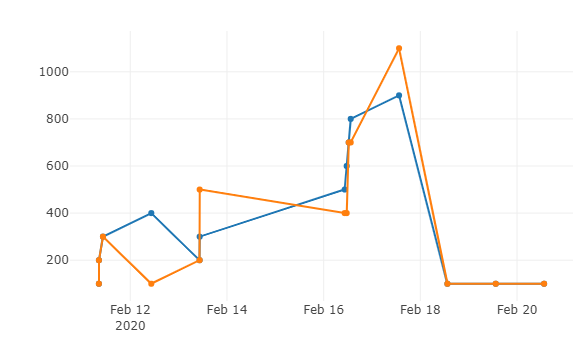
newplot (1)

For each Input or Statecomponent assoc. with a callback, the function declaration needs account for each.

So, change def update_graph() to def update_graph(your_desired_ref_to_n_intervals)

Could you give me an example? Im little bit confouse about this callback.

now i got this return:

dash.exceptions.InvalidCallbackReturnValue:
The callback for <Output example-graph.figure>
returned a value having type DataFrame
which is not JSON serializable.

The value in question is either the only value returned,
or is in the top level of the returned list,
and has string representation
Hora x y 0 2020-02-11 08:25:46 100 100 1 2020-02-11 08:26:46 200 200 2 2020-02-11 10:26:46 300 300 3 2020-02-12 10:26:46 400 100 4 2020-02-13 10:25:46 200 200 5 2020-02-13 10:26:46 300 500 6 2020-02-16 10:25:46 500 400 7 2020-02-16 11:25:46 600 400 8 2020-02-16 12:25:46 700 700 9 2020-02-16 13:25:46 800 700 10 2020-02-17 13:25:46 900 1100 11 2020-02-18 13:25:46 100 100 12 2020-02-19 13:25:46 100 100 13 2020-02-20 13:25:46 100 100 14 2020-02-20 14:25:46 500 500

In general, Dash properties can only be
dash components, strings, dictionaries, numbers, None,
or lists of those.

The online docs are a good place for examples. See https://dash.plot.ly/getting-started-part-2

Your callback output is the figure property of your example-graph. The output needs to be formatted accordingly (i.e.formatted exactly as you defined figure= in the serve_layout function.

I have three possibles ids to use in output, i used example-graph to represent my graph.

callback: [‘my-id’, ‘example-graph’, ‘interval-component’]

And figure, represents the data composition in my dashboard.

Does it wrong?

Per the documentation, https://dash.plot.ly/dash-core-components/graph, you need to return a dict formatted as indicated below vice a dataframe. Format is the same as you have done in the serve_layout function when creating the dcc.Graph component.

figure ( dict ; default { data: [], layout: {}, frames: [], } ): Plotly figure object. See schema: https://plot.ly/javascript/reference config is set separately by the config property. figure has the following type: dict containing keys ‘data’, ‘layout’, ‘frames’. Those keys have the following types:

  • data (list of dicts; optional)
  • layout (dict; optional)
  • frames (list of dicts; optional)

Hi, i adjust my callback, now my dataframe has updated but the graph dont use the value from dataframe.

my callback :


@app.callback(
    Output('example-graph','figure'),
    [Input('interval-component', 'n_intervals')])
def update_graph(n_intervals):
    df = get_value()
    return  \
        dcc.Graph(id='example-graph', animate=True,
                  figure={'data': [
                      {'x': df.Hora, 'y': df.x, 'type': 'line', 'name': 'Mobile'},
                      {'x': df.Hora, 'y': df.y, 'type': 'line', 'name': 'Desktop'},

                  ],
                      'layout': {'title': 'Logins Por hora'}
                  }
                  ),

if __name__ == '__main__':
    app.run_server(debug=False)


what do you think?

return of dataframe:
0 2020-02-17 13:25:46 900 1100
11 2020-02-18 13:25:46 100 100
12 2020-02-19 13:25:46 100 100
13 2020-02-20 13:25:46 100 100
14 2020-02-20 14:25:46 500 500
15 2020-02-20 15:25:46 100 100
16 2020-02-20 16:25:46 200 200

I got this code working. Since I don’t have access to your database, I created a random dataframe in get_value. There may be some weird caching going on wrt to your database; for some reason I needed to alter the seed in my implementation in order for get_value to return a fresh result. I hope this gets you further along.

Also, in your update_graph callback, you only needed to return the dict as I have shown. If, however, your callback had Output['example-graph', 'children'] then returning the dcc.Graph would have worked.

import dash
import dash_core_components as dcc
import dash_html_components as html
from dash.dependencies import Input, Output

# These imports only needed due to temp. code in get_value function
import pandas as pd
import numpy as np
from datetime import datetime, timedelta

app = dash.Dash(__name__)

def get_value(n_intervals):
    date_today = datetime.now()
    days = pd.date_range(date_today, date_today + timedelta(7), freq='D')

    np.random.seed(seed=111 * n_intervals)
    data = np.random.randint(1, high=100, size=len(days))
    data2 = np.random.randint(100, high=200, size=len(days))
    df = pd.DataFrame(data={'Hora': days, 'x': data, 'y': data2})
    return df


def serve_layout():
    return html.Div(
        children=[
            html.H4(children='Dashboard'),
            html.Div(id='my-id', children='''Events'''),
            dcc.Graph(id='example-graph', animate=True),
            dcc.Interval(
                id='interval-component',
                interval=5 * 1000,
                n_intervals=0,
            ),
        ],
    )


app.layout = serve_layout

@app.callback(
    Output('example-graph','figure'),
    [Input('interval-component', 'n_intervals')])
def update_graph(n_intervals):
    df = get_value(n_intervals)

    return  \
        {
            'data': [
                {'x': df.Hora, 'y': df.x, 'type': 'line', 'name': 'Mobile'},
                {'x': df.Hora, 'y': df.y, 'type': 'line', 'name': 'Desktop'},
            ],
            'layout': {'title': 'Logins Por hora'}
        }

if __name__ == '__main__':
    app.run_server(debug=True)

Thank you for the help.

I have some points:
1 - When i used children, Output(‘example-graph’,‘children’), as you said, i got this error:

dash.exceptions.NonExistentPropException: 
Attempting to assign a callback with
the property "children" but the component
"example-graph" doesn't have "children" as a property.

Here are the available properties in "example-graph":
['id', 'responsive', 'clickData', 'clickAnnotationData', 'hoverData', 'clear_on_unhover', 'selectedData', 'relayoutData', 'extendData', 'restyleData', 'figure', 'style', 'className', 'animate', 'animation_options', 'config', 'loading_state']

2 - I’ve adjust my value

def get_value(n_intervals):
        np.random.seed(seed=111 * n_intervals)
         df = blackbootle.select_dashboard_view().array_from_Mysql()
return df

I saw, the code has to much requests so fast, that the dashboard cant update automaticaly.

maybe this can be the problem of my graph, because he dosent update properly.

obs.
this line return a select from a mysql, with 3 values, data, x(int), y(int).
blackbootle.select_dashboard_view().array_from_Mysql()

When i do a insert in this database, a new line on dataframe will be create in df but my graph dosent update.
maybe should i do a update with new line in the dataframe and stop to create a new DF in every select?

Hi,

I made some adjustements, may can you validate, please?

i add the function, for create new line to plot every return:

points = 0
def test():
    global points
    points += 1

i also insert this line at return to resize the graph, but i dont know if doest it its the rigth way.

   'layout': go.Layout(xaxis=dict(range=[min(df.Hora),max(df.Hora)]),yaxis=dict(range=[min(df.x),max(df.y)]),)
import dash
import dash_core_components as dcc
import dash_html_components as html
from dash.dependencies import Input, Output
import plotly.graph_objs as go

# These imports only needed due to temp. code in get_value function
import pandas as pd
import numpy as np
from datetime import datetime, timedelta

app = dash.Dash(__name__)

points = 0
def test():
    global points
    points += 1

def get_value(n_intervals):
    date_today = datetime.now()
    days = pd.date_range(date_today, date_today + timedelta(points), freq='D')
    np.random.seed(seed=111 * n_intervals)
    data = np.random.randint(1, high=100, size=len(days))
    data2 = np.random.randint(60000, high=90000, size=len(days))
    df = pd.DataFrame(data={'Hora': days, 'x': data, 'y': data2})
    print(df)
    return df


def serve_layout():
    return html.Div(
        children=[
            html.H4(children='Dashboard'),
            html.Div(id='my-id', children='''Events'''),
            dcc.Graph(id='example-graph', animate=True, responsive=True),
            dcc.Interval(
                id='interval-component',
                interval=5 * 1000,
                n_intervals=0,
            ),
        ],
    )

app.layout = serve_layout

@app.callback(
    Output('example-graph','figure'),
    [Input('interval-component', 'n_intervals')])
def update_graph(n_intervals):
    df = get_value(n_intervals)
    test()
    return  \
        {
            'data': [
                {'x': df.Hora, 'y': df.x, 'type': 'line', 'name': 'Mobile'},
                {'x': df.Hora, 'y': df.y, 'type': 'line', 'name': 'Desktop'},
            ],
            'layout': go.Layout(xaxis=dict(range=[min(df.Hora),max(df.Hora)]),yaxis=dict(range=[min(df.x),max(df.y)]),)
        }

if __name__ == '__main__':
    app.run_server(debug=True)

maybe my conde didnt upgrade because the data alwayes be the same and the graph didnt resize, i will try again on monday with this code.

Thank you,.

Thank you for the help.

looks good. ran ok for me. If you sql query takes some time to return, increase the interval-component…every 5 seconds may be too aggressive.

1 Like