Hello there,
I’m new here but I thought you might help me.
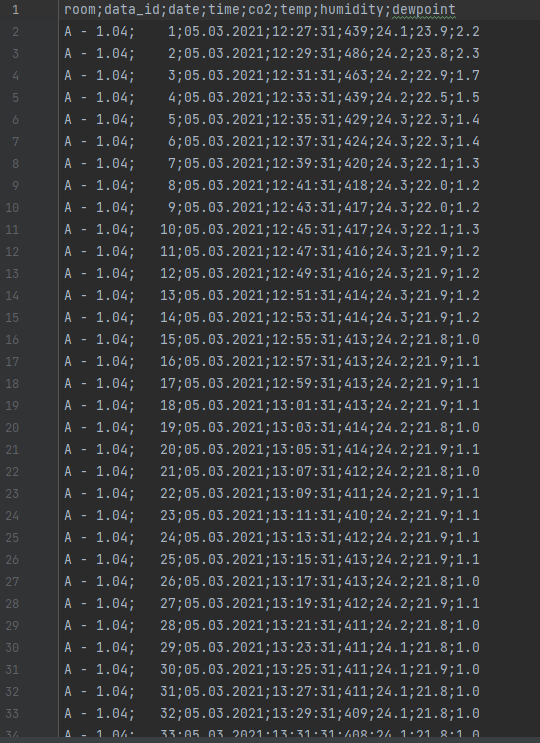
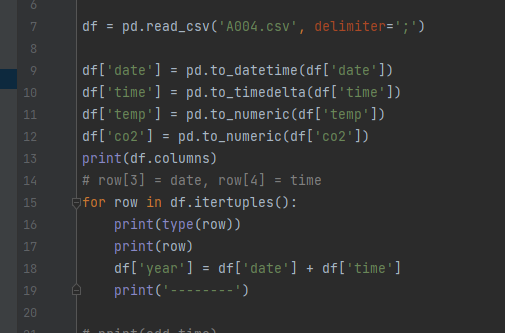
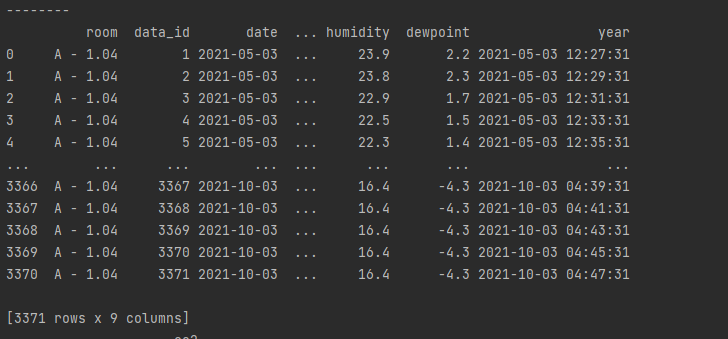
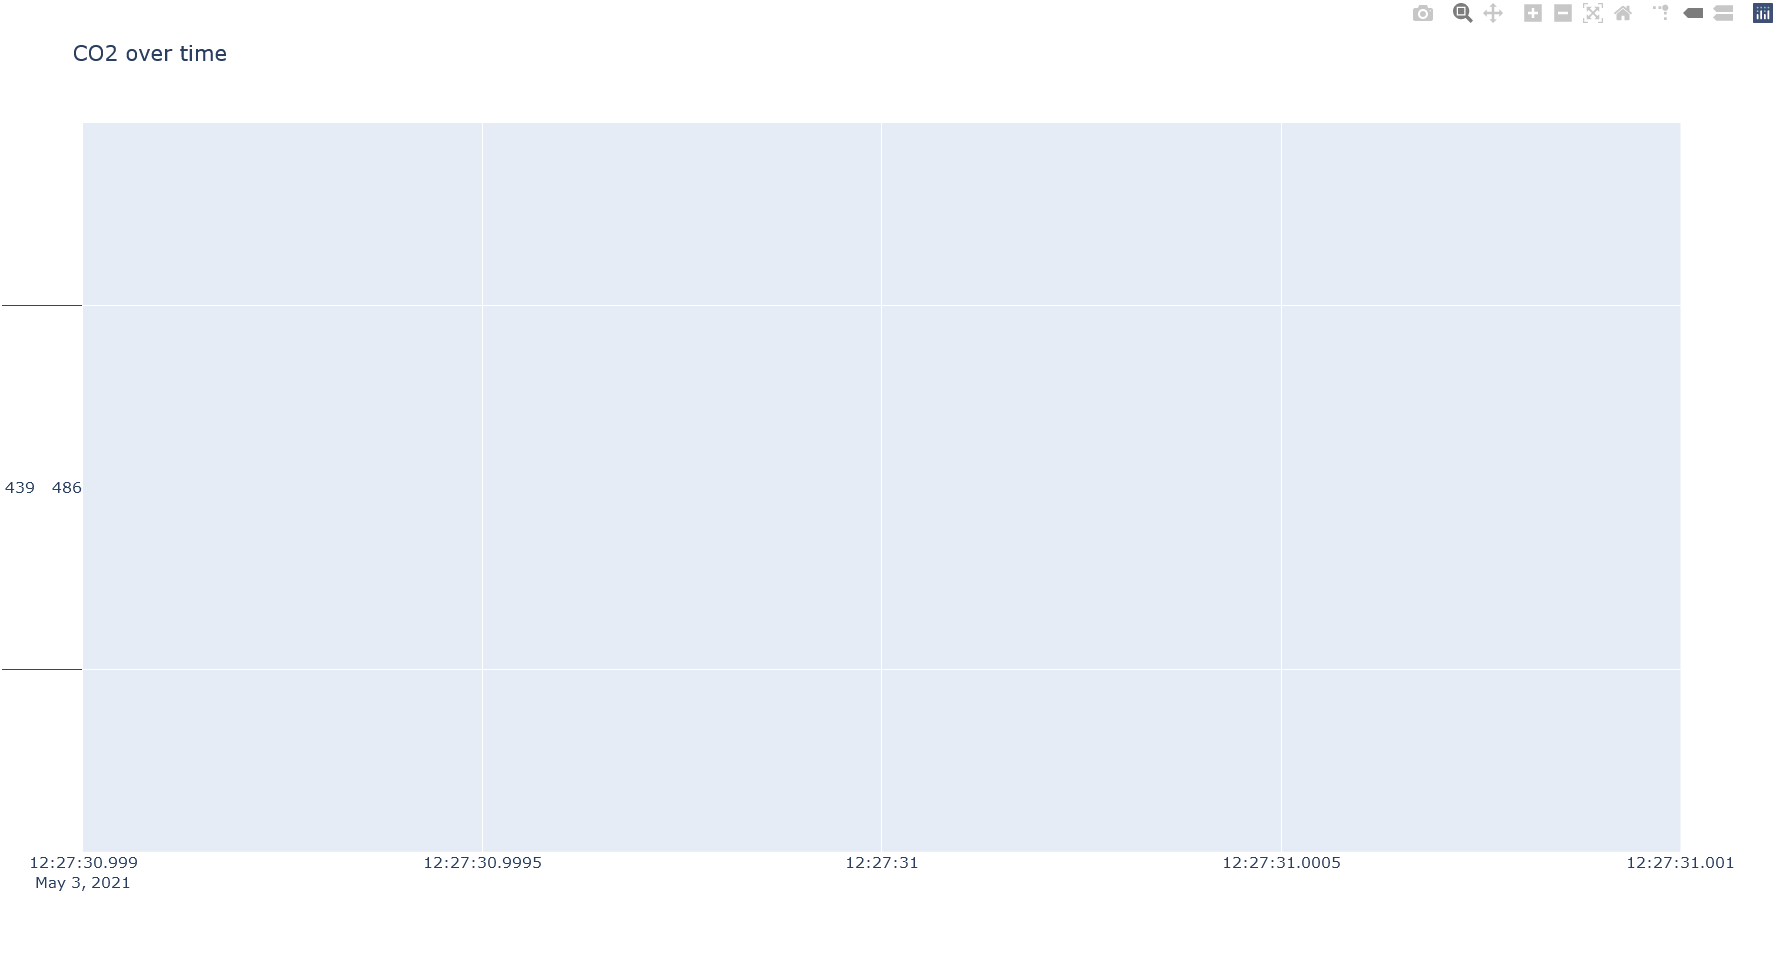
I have a dataset with multiple dates per day. Data is recorded every 120 sec. I have two columns in the original csv for the time. Date and Time. So I converted date to datetime and time to timedelta. The result from addition these two seems good. But I can’t plot the values per date_time. The time axis seems not to recognize the time.
I’ll add pictures in the topic.

Could I do something better to describe the Problem?