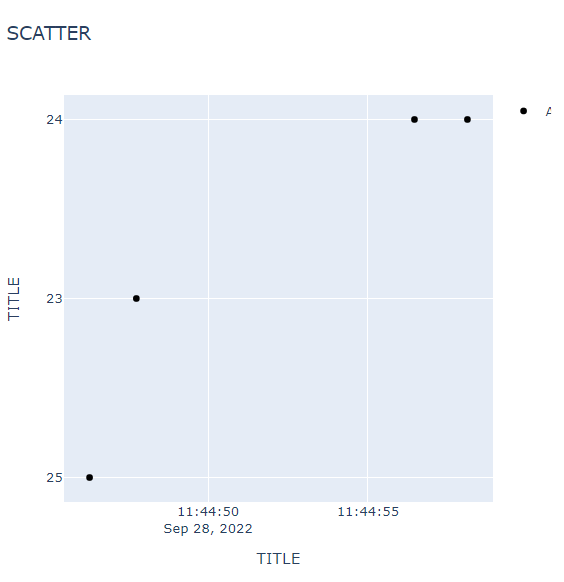
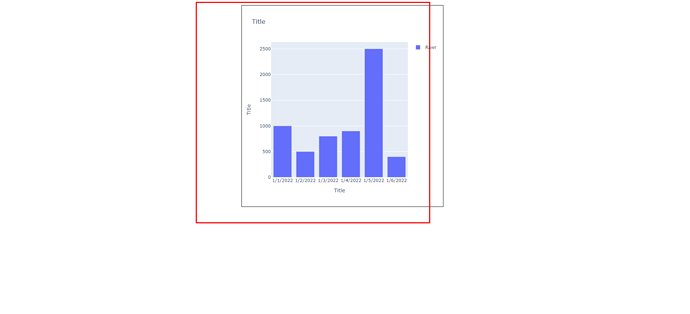
What’s the reason why my graph legend is cut off when I refresh the page?
app.layout = html.Div([
        html.Div(id='graphs', children=[], style={
                 'display': 'flex', 'flex-wrap': 'wrap', 'justify-content': 'center'}),
])
@app.callback(Output('graphs', 'children'),
              Input('graphs', 'children'))
def update_extend_traces_traceselect(child):
                fig = go.Figure()
                fig.add_trace(
                    go.Bar(
                        y=[yvalue,
                        x=[date],
                        name=barname,
                    ))
            fig.update_layout(
                xaxis_title=xtitle,
                yaxis_title=ytitle,
                title=title,)
            child.append(dcc.Graph(figure=fig,
                                   }, style={'height': '550px', 'width': '550px', 'margin': '10px',
                                             'border': '1px solid'}))
 return child
<div class="flex">
  <div
    id="plotly"
    class="{% plotly_class name='OverviewChart' %} z-0 bg-white border shadow rounded w-full"
  >
    {% plotly_app name='OverviewChart' ratio=1%}
  </div>
</div>


