I tried the following code from the plotly homepage and only changed one word …
import plotly.plotly as py - > new-> import plotly.offline as py
import plotly.offline as py
import plotly.graph_objs as go

trace1 = go.Scatter(
    x=[1, 2, 3, 4],
    y=[1, 4, 9, 16],
    name='$\\alpha_{1c} = 352 \\pm 11 \\text{ km s}^{-1}$'
)
trace2 = go.Scatter(
    x=[1, 2, 3, 4],
    y=[0.5, 2, 4.5, 8],
    name='$\\beta_{1c} = 25 \\pm 11 \\text{ km s}^{-1}$'
)
data = [trace1, trace2]
layout = go.Layout(
    xaxis=dict(
        title='$\\sqrt{(n_\\text{c}(t|{T_\\text{early}}))}$'
    ),
    yaxis=dict(
        title='$d, r \\text{ (solar radius)}$'
    )
)
fig = go.Figure(data=data, layout=layout)
plot_url = py.plot(fig, filename='latex')
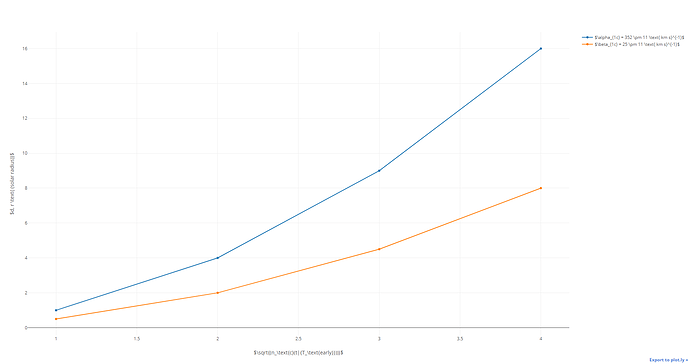
I got this graph:
Why isn’t the LaTeX code interpreted? Do I somthing wronge?
Thanks,
Peter


