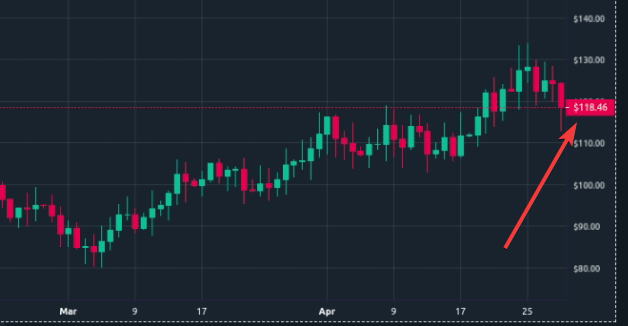
How can I add a display of the last value on the y-axis?
For example, like here:
I tried to solve the problem myself using annotations, but it looks very ugly:

Help me please…
Can you at least tell me how to position the annotation on the y-axis? When you add text to the annotation, it shifts to the left, and I need the beginning of the text to start strictly on the axis .

This is the code I use:
{
        xref: "paper",
        yref: "y",
        x: 1.01,
        y: ohlc.close[ohlc.close.length - 1],
        bgcolor: "#4cdd7a",
        bordercolor: "#4cdd7a",
        align: "right",
        text: '<b>' + currentPrice + "</b>",
        showarrow: false,
        font: {
            family: "Arial",
            size: 10,
            color: "black",
        },
    }
Hi @Sandr0oo you are talking about the x- position, right? You have to modify the x:1.01 to something else. try 1.1
I think I’ve found a solution.
{
        xref: "paper",
        yref: "y",
        x: 1.005,
        xanchor: "left",
        y: ohlc.close[ohlc.close.length - 1],
        bgcolor: "#4cdd7a",
        bordercolor: "#4cdd7a",
        align: "center",
        text: '<b>' + currentPrice + '</b>',
        showarrow: false,
        font: {
            family: "Arial",
            size: 10,
            color: "black",
        },
    }

1 Like