import copy
import dash
from dash.dependencies import Input, Output
import dash_html_components as html
import dash_core_components as dcc
import datetime
from flask_caching import Cache
import numpy as np
import os
import pandas as pd
import time
import tushare as ts


app = dash.Dash(__name__)
cache = Cache(app.server, config={
    'CACHE_TYPE': 'filesystem',
    'CACHE_DIR': 'cache'
})

stock_ticker=['600729','600004','600260','600069','600781','600668']

app.layout = html.Div([
    dcc.Dropdown(
        id='dropdown',
        options=[{'label': i, 'value': i} for i in stock_ticker],
        value=['600668','600004'],
        multi=True
    ),
    html.Div([
        html.Div(dcc.Graph(id='graph-1'), className="six columns"),
    ], className="row"),


    # hidden signal value
    html.Div(id='signal', style={'display': 'none'})
])


# perform expensive computations in this "global store"
# these computations are cached in a globally available
# redis memory store which is available across processes
# and for all time.
@cache.memoize()
def global_store(value):
    # simulate expensive query
    print('Computing value with {}'.format(value))

    price=pd.read_csv('matrix_table.csv')[value]
    return price


def generate_figure(value, figure):
    fig = copy.deepcopy(figure)
    filtered_dataframe = global_store(value)
    fig['data'][0]['x'] = [str(i) for i in filtered_dataframe.index]
    fig['data'][0]['z'] = [str(i) for i in filtered_dataframe.index]
    fig['data'][0]['y'] = [col.tolist() for index,col in filtered_dataframe.iterrows()]
    fig['layout'] = {'margin': {'l': 20, 'r': 10, 'b': 20, 't': 10}}
    print(fig['data'][0]['y'])
    return fig


@app.callback(Output('signal', 'children'), [Input('dropdown', 'value')])
def compute_value(value):
    # compute value and send a signal when done
    global_store(value)
    return value


@app.callback(Output('graph-1', 'figure'), [Input('signal', 'children')])
def update_graph_1(value):
    # generate_figure gets data from `global_store`.
    # the data in `global_store` has already been computed
    # by the `compute_value` callback and the result is stored
    # in the global redis cached
    return generate_figure(value, {
        'data': [{
            'type': 'histogram2d',  # it is supposed to be 'heatmap' type, but it wont work and i dont know why.
#            'mode': 'markers',
            'marker': {
                'opacity': 0.5,
                'size': 14,
                'line': {'border': 'thin darkgrey solid'}
            }
        }]
    })


# Dash CSS
app.css.append_css({
    "external_url": "https://codepen.io/chriddyp/pen/bWLwgP.css"})
# Loading screen CSS
app.css.append_css({
    "external_url": "https://codepen.io/chriddyp/pen/brPBPO.css"})

if __name__ == '__main__':
    app.run_server(debug=True, processes=1)
Edit: Woops, my bad, I didn’t realise that plotly.graph_objs just defines convenience classes that generate dictionaries. So my comment below is not helpful. Sorry!
The ‘data’ attribute in generate_figure doesn’t look right. It should be a list of plotly graph objects from plotly.graph_objs. For example:
import plotly.graph_objs as go

figure = {'data':[go.Heatmap(........)]}
This is the modified code I have tried out. No graph displays either.
import copy
import dash
from dash.dependencies import Input, Output
import dash_html_components as html
import dash_core_components as dcc
import plotly.graph_objs as go
import datetime
from flask_caching import Cache
import numpy as np
import os
import pandas as pd
import time


app = dash.Dash(__name__)
cache = Cache(app.server, config={
    'CACHE_TYPE': 'filesystem',
    'CACHE_DIR': 'cache'
})

stock_ticker=['600729','600004','600260','600069','600781','600668']

app.layout = html.Div([
    dcc.Dropdown(
        id='dropdown',
        options=[{'label': i, 'value': i} for i in stock_ticker],
        value=['600668','600004'],
        multi=True
    ),
    html.Div([
        html.Div(dcc.Graph(id='graph-1'), className="six columns"),
    ], className="row"),


    # hidden signal value
    html.Div(id='signal', style={'display': 'none'})
])


# perform expensive computations in this "global store"
# these computations are cached in a globally available
# redis memory store which is available across processes
# and for all time.
@cache.memoize()
def global_store(value):
    # simulate expensive query
    print('Computing value with {}'.format(value))

    price=pd.read_csv('matrix_table.csv')[value]
    return price


#def generate_figure(value, figure):
#    fig = copy.deepcopy(figure)
#    filtered_dataframe = global_store(value)
#    fig['data'][0]['x'] = [str(i) for i in filtered_dataframe.index]
#    fig['data'][0]['z'] = [str(i) for i in filtered_dataframe.index]
#    fig['data'][0]['y'] = [col.tolist() for index,col in filtered_dataframe.iterrows()]
#    fig['layout'] = {'margin': {'l': 20, 'r': 10, 'b': 20, 't': 10}}
#    print(fig['data'][0]['y'])
#    return fig

#                        )

@app.callback(Output('signal', 'children'), [Input('dropdown', 'value')])
def compute_value(value):
    # compute value and send a signal when done
    global_store(value)
    return value


@app.callback(Output('graph-1', 'figure'), [Input('signal', 'children')])
def update_graph_1(value):
    # generate_figure gets data from `global_store`.
    # the data in `global_store` has already been computed
    # by the `compute_value` callback and the result is stored
    # in the global redis cached
    df = global_store(value)
    print(df.columns.tolist())
    print(df)
    return dcc.Graph(
        id='gg',
        figure={
            'data': [go.Heatmap(x = [df.columns.tolist()],
                                z = [col.tolist() for index,col in df.iterrows()],
                                y = [df.columns.tolist()],)],
            'layout': {'margin': {'l': 20, 'r': 10, 'b': 20, 't': 10}}
                }
                    )


# Dash CSS
app.css.append_css({
    "external_url": "https://codepen.io/chriddyp/pen/bWLwgP.css"})
# Loading screen CSS
app.css.append_css({
    "external_url": "https://codepen.io/chriddyp/pen/brPBPO.css"})

if __name__ == '__main__':
    app.run_server(debug=True, processes=1)
The update_graph_1 callback is targeting the graph’s figure property but returning an entire Graph component. I think you just wanna return a figure dictionary.
I am sorry folks. I just realized I make a mistake on value input z passed to heatmap.
this is correct code below:
def generate_figure(value, figure):
    fig = copy.deepcopy(figure)
    filtered_dataframe = global_store(value)
    fig['data'][0]['x'] = [str(i) for i in filtered_dataframe.index]
    fig['data'][0]['y'] = [str(i) for i in filtered_dataframe.index]
    fig['data'][0]['z'] = [col.tolist() for index,col in filtered_dataframe.iterrows()]
    fig['layout'] = {'margin': {'l': 20, 'r': 10, 'b': 20, 't': 10}}
    print(fig['data'][0]['y'])
    return fig
.........

@app.callback(Output('graph-1', 'figure'), [Input('signal', 'children')])
def update_graph_1(value):
    # generate_figure gets data from `global_store`.
    # the data in `global_store` has already been computed
    # by the `compute_value` callback and the result is stored
    # in the global redis cached
    return generate_figure(value, {
        'data': [{
            'type': 'heatmap',  # corrected
#            'mode': 'markers',
            'marker': {
                'opacity': 0.5,
                'size': 14,
                'line': {'border': 'thin darkgrey solid'}
            }
        }]
    })
Ahh, ok so first of all, my apologies, I didn’t realise that plotly.graph_objs are just convenience classes that generate chart dictionaries. So my suggestion about having to use those classes was wrong. Sorry!
The problem I was pointing out in the second code block you posted was that you were returning a Graph component in the callback when it was targeting the figure property of a Graph in the layout. So you just needed to return the figure only. I think now that you fixed that other problem the version using go.Heatmap should work now.
import copy
import dash
from dash.dependencies import Input, Output
import dash_html_components as html
import dash_core_components as dcc
import plotly.graph_objs as go
import datetime
from flask_caching import Cache
import numpy as np
import os
import pandas as pd
import time


app = dash.Dash(__name__)
cache = Cache(app.server, config={
    'CACHE_TYPE': 'filesystem',
    'CACHE_DIR': 'cache'
})

stock_ticker=['600729','600004','600260','600069','600781','600668']

app.layout = html.Div([
    dcc.Dropdown(
        id='dropdown',
        options=[{'label': i, 'value': i} for i in stock_ticker],
        value=['600668','600004'],
        multi=True
    ),
    html.Div([
        html.Div(id='graph-1'),
    ]),


    # hidden signal value
    html.Div(id='signal', style={'display': 'none'})
])


# perform expensive computations in this "global store"
# these computations are cached in a globally available
# redis memory store which is available across processes
# and for all time.
@cache.memoize()
def global_store(value):
    # simulate expensive query
    print('Computing value with {}'.format(value))

    price=pd.read_csv('matrix_table.csv')[value]
    return price


@app.callback(Output('signal', 'children'), [Input('dropdown', 'value')])
def compute_value(value):
    # compute value and send a signal when done
    global_store(value)
    return value


@app.callback(Output('graph-1', 'children'), [Input('signal', 'children')])
def update_graph_1(value):
    # generate_figure gets data from `global_store`.
    # the data in `global_store` has already been computed
    # by the `compute_value` callback and the result is stored
    # in the global redis cached
    df = global_store(value)
    print(df.columns.tolist())
    print(df)
    return dcc.Graph(
        id='gg',
        figure={
            'data': [go.Heatmap(x = ['-{}-'.format(i) for i in df.columns],
                                z = [col.tolist() for index,col in df.iterrows()],
                                y = ['-{}-'.format(i) for i in df.columns])
                                ],
            'layout': {'margin': {'l': 20, 'r': 10, 'b': 20, 't': 10}}
                }
                    )


# Dash CSS
app.css.append_css({
    "external_url": "https://codepen.io/chriddyp/pen/bWLwgP.css"})
# Loading screen CSS
app.css.append_css({
    "external_url": "https://codepen.io/chriddyp/pen/brPBPO.css"})

if __name__ == '__main__':
    app.run_server(debug=True, processes=1)
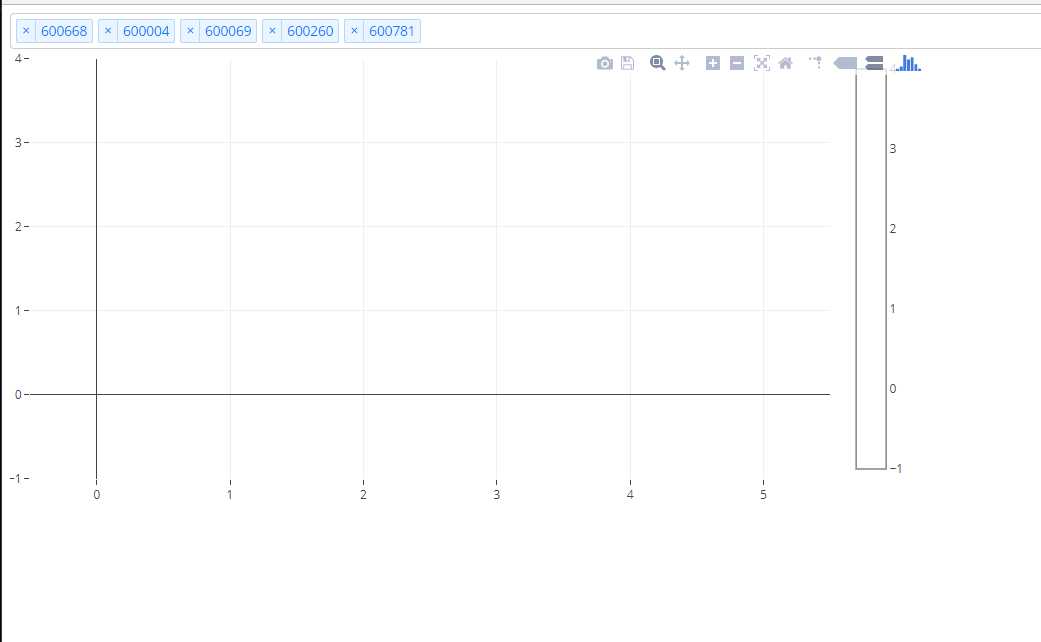
But there is a tiny little issue related to the x,y label. the label cant be displayed correctly with pure numbers. That is why I put two dash "-"next to the x and y labels. Any suggestion?