Hello,
I am still fairly new to the plotly charts. I wanted to create race chart and mostly I was successful but there are some thing I was simply not able to figure out (even with GPT).
Description of the visual
I downloaded list of NBA champions by YEAR.
Each year, the graph updates to show teams that have won at least one championship up to that point.
-New teams appear in the graph when they win their first championship.
-Teams move up as they win more championships.
-The team with the most championships is always at the top.
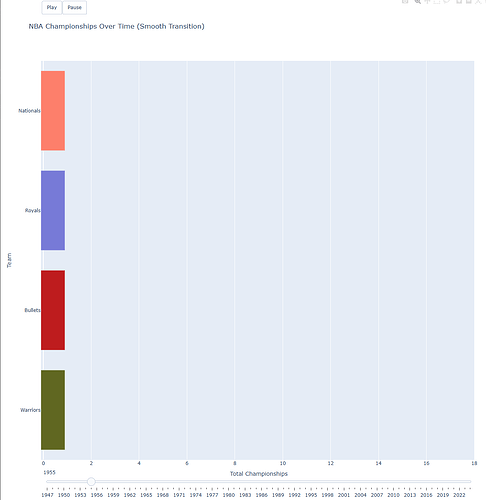
The issue is when I click play and a new team is added to chart, other team on top of the list is hidden out of the visual (up) so it doesn’t show correctly the data for each year.
For example, when you click play and then pause in 1955, you can see only Warrior(1947), Bullets (1948) and Royals (1951) and Nationals (1955) but Lakers (1949,1950,1952,1953,1954) - which should be on top, Completely disappear (to the up) for that year. And in 1956,1957 it is still not there. (see picture below)
I would like to see all the bars every year while keep the nice looking animation.
Thanks a lot in advance for any help.
Full code:
import plotly.graph_objects as go
import pandas as pd
import random

# Provided data
data = [
    ('Warriors', 1, 1947), ('Bullets', 1, 1948), ('Lakers', 1, 1949), ('Lakers', 1, 1950),
    ('Royals', 1, 1951), ('Lakers', 1, 1952), ('Lakers', 1, 1953), ('Lakers', 1, 1954),
    ('Nationals', 1, 1955), ('Warriors', 1, 1956), ('Celtics', 1, 1957), ('Hawks', 1, 1958),
    ('Celtics', 1, 1959), ('Celtics', 1, 1960), ('Celtics', 1, 1961), ('Celtics', 1, 1962),
    ('Celtics', 1, 1963), ('Celtics', 1, 1964), ('Celtics', 1, 1965), ('Celtics', 1, 1966),
    ('76ers', 1, 1967), ('Celtics', 1, 1968), ('Celtics', 1, 1969), ('Knicks', 1, 1970),
    ('Bucks', 1, 1971), ('Lakers', 1, 1972), ('Knicks', 1, 1973), ('Celtics', 1, 1974),
    ('Warriors', 1, 1975), ('Celtics', 1, 1976), ('Blazers', 1, 1977), ('Bullets', 1, 1978),
    ('SuperSonics', 1, 1979), ('Lakers', 1, 1980), ('Celtics', 1, 1981), ('Lakers', 1, 1982),
    ('76ers', 1, 1983), ('Celtics', 1, 1984), ('Lakers', 1, 1985), ('Celtics', 1, 1986),
    ('Lakers', 1, 1987), ('Lakers', 1, 1988), ('Pistons', 1, 1989), ('Pistons', 1, 1990),
    ('Bulls', 1, 1991), ('Bulls', 1, 1992), ('Bulls', 1, 1993), ('Rockets', 1, 1994),
    ('Rockets', 1, 1995), ('Bulls', 1, 1996), ('Bulls', 1, 1997), ('Bulls', 1, 1998),
    ('Spurs', 1, 1999), ('Lakers', 1, 2000), ('Lakers', 1, 2001), ('Lakers', 1, 2002),
    ('Spurs', 1, 2003), ('Pistons', 1, 2004), ('Spurs', 1, 2005), ('Heat', 1, 2006),
    ('Spurs', 1, 2007), ('Celtics', 1, 2008), ('Lakers', 1, 2009), ('Lakers', 1, 2010),
    ('Mavericks', 1, 2011), ('Heat', 1, 2012), ('Heat', 1, 2013), ('Spurs', 1, 2014),
    ('Warriors', 1, 2015), ('Cavaliers', 1, 2016), ('Warriors', 1, 2017), ('Warriors', 1, 2018),
    ('Raptors', 1, 2019), ('Lakers', 1, 2020), ('Bucks', 1, 2021), ('Warriors', 1, 2022),
    ('Nuggets', 1, 2023), ('Celtics', 1, 2024)
]

# Convert to DataFrame
df = pd.DataFrame(data, columns=['Team', 'Wins', 'Year'])
# Set option to display all rows
pd.set_option('display.max_rows', None)
# Compute cumulative wins over time
df['Cumulative_Wins'] = df.groupby('Team').cumcount() + 1


# Get unique teams and assign random colors
unique_teams = df['Team'].unique()
team_colors = {team: f"#{random.randint(0, 0xFFFFFF):06x}" for team in unique_teams}

# Create a fixed team order based on first appearance and total wins
team_totals = df.groupby('Team')['Wins'].sum().sort_values(ascending=False)
team_order = team_totals.index.tolist()

# Get all teams that will ever appear
all_teams = df['Team'].unique()

# Get final total wins for each team to establish a consistent order
final_team_wins = df.groupby('Team')['Wins'].sum().sort_values(ascending=False)
fixed_team_order = final_team_wins.index.tolist()

# Create frames for animation
frames = []
unique_years = sorted(df['Year'].unique())

for year in unique_years:
    df_filtered = df[df['Year'] <= year]

    # Create a DataFrame with all teams, initializing wins to 0
    team_wins = pd.DataFrame({'Team': all_teams, 'Wins': 0})

    # Update wins for teams that have won championships
    actual_wins = df_filtered.groupby('Team')['Wins'].sum().reset_index()
    team_wins = team_wins.merge(actual_wins, on='Team', how='left')
    team_wins['Wins'] = team_wins['Wins_y'].fillna(team_wins['Wins_x'])
    team_wins = team_wins[['Team', 'Wins']]

    # Sort using the fixed order of teams based on their final total wins
    team_wins['Sort_Order'] = team_wins['Team'].map({team: idx for idx, team in enumerate(fixed_team_order)})
    team_wins = team_wins[team_wins['Wins'] > 0].sort_values('Sort_Order')

    print('team_wins')
    print(team_wins)

    frames.append(
        go.Frame(
            data=[
                go.Bar(
                    y=team_wins['Team'],
                    x=team_wins['Wins'],
                    orientation='h',
                    marker=dict(color=[team_colors[team] for team in team_wins['Team']]),
                )
            ],
            name=str(year)
        )
    )

# Calculate max cumulative wins for x-axis range
max_wins = df.groupby('Team')['Wins'].sum().max()

# Initialize with first year's data
initial_year = unique_years[0]
initial_data = frames[0].data[0]

# Create the figure with modified initial data
fig = go.Figure(
    data=[initial_data],
    frames=frames
)

# Layout settings
fig.update_layout(
    title="NBA Championships Over Time (Smooth Transition)",
    yaxis_title="Team",
    xaxis_title="Total Championships",
    xaxis=dict(range=[0, max_wins]),  # Set fixed x-axis range
    yaxis=dict(
        autorange=True,
        categoryorder="total ascending"
    ),
    transition = dict(
        duration=500,
        easing="linear",
        # ordering="traces first"
    ),
    updatemenus=[  # Play/Pause buttons
        {
            "buttons": [
                {
                    "args": [None, {"frame": {"duration": 500,}, "fromcurrent": True,
                                    "transition": {"duration": 500, "easing": "circle-out"}}],
                    "label": "Play",
                    "method": "animate",
                },
                {
                    "args": [[None], {"frame": {"duration": 0, "redraw": True}, "mode": "immediate"}],
                    "label": "Pause",
                    "method": "animate",
                },
            ],
            "direction": "left",
            "showactive": False,
            "type": "buttons",
            "x": 0.1,
            "y": 1.15,
        }
    ],
    sliders=[  # Year slider
        {
            "steps": [
                {
                    "args": [[str(year)], {"frame": {"duration": 0, "redraw": True}, "mode": "immediate"}],
                    "label": str(year),
                    "method": "animate",
                }
                for year in unique_years
            ],
        }
    ]
)

# Show the chart
fig.show()

