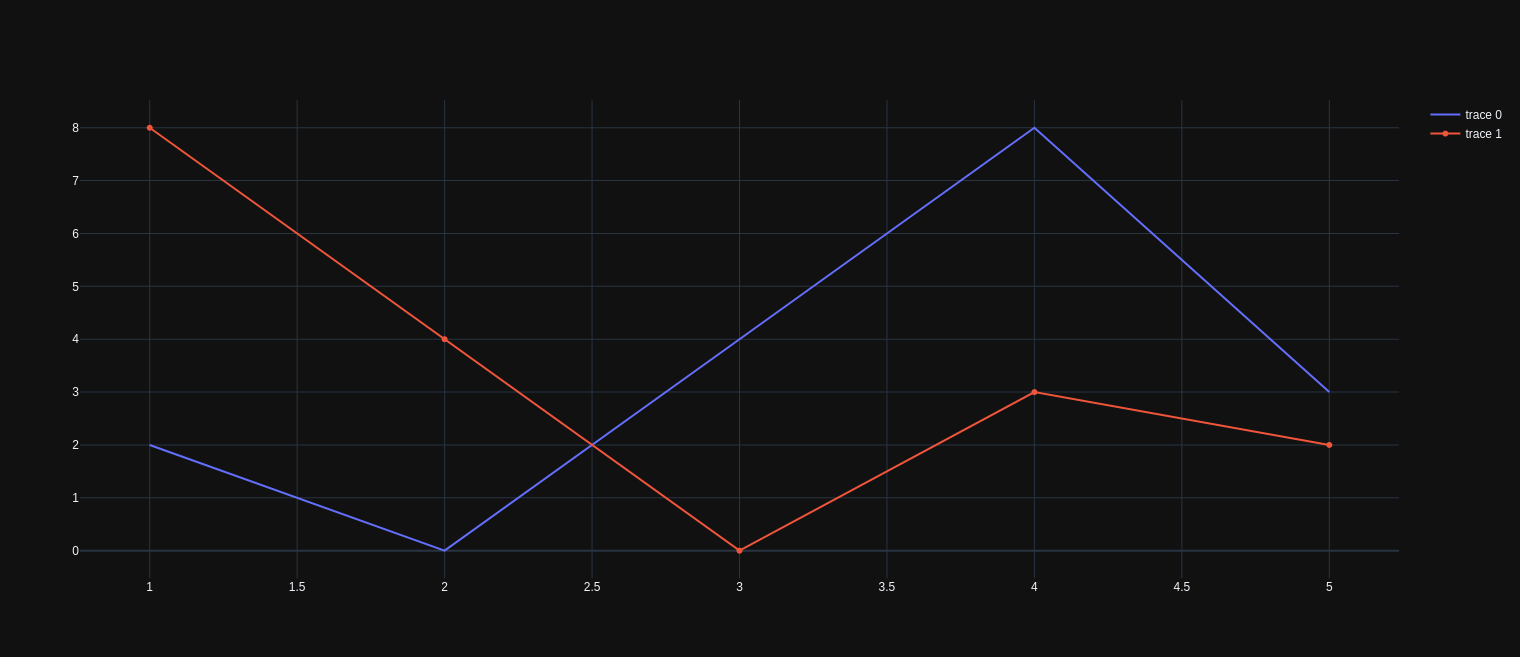
I’ve spent the last week making a very detailed chart using mode=lines exclusively and noticed when I added a lines+markers Scatter plot suddenly the x scale jumps around when it’s toggled on and off. If this is intentional, it’s very annoying!
Simple example:
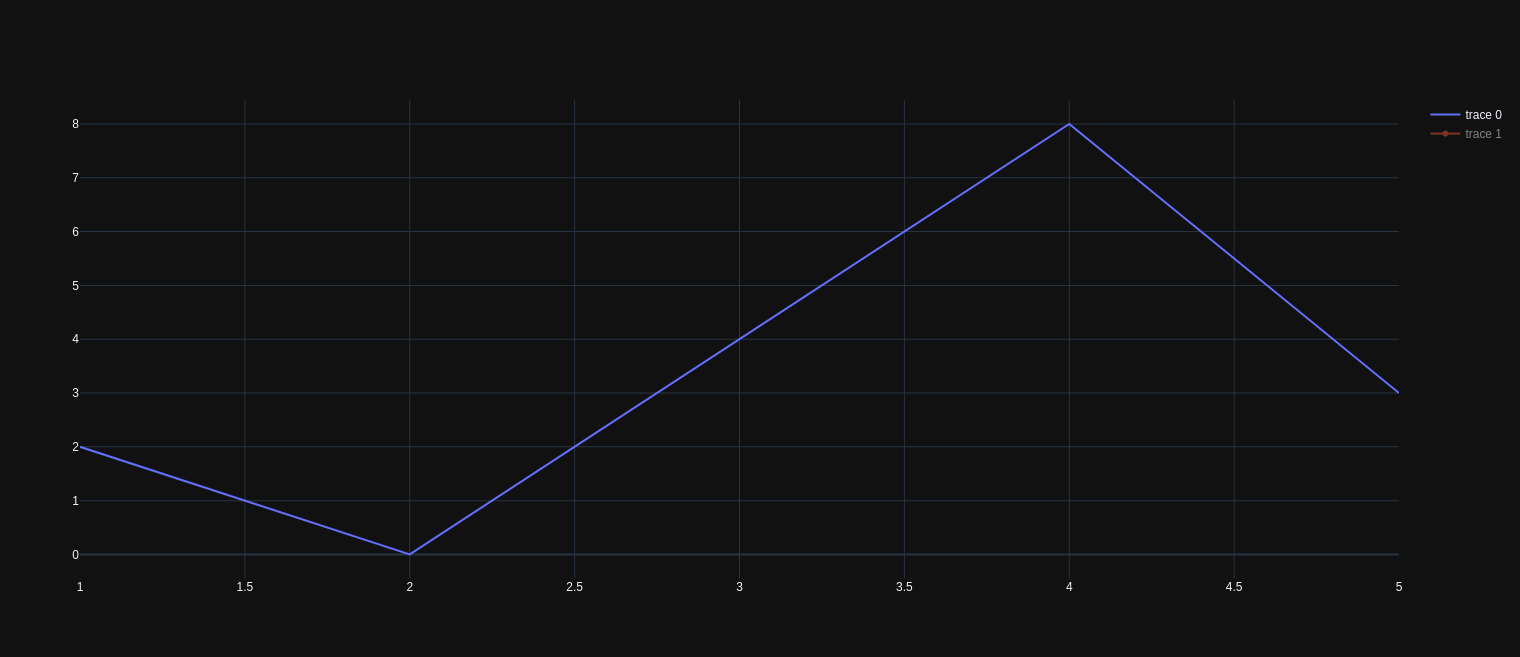
x = [1, 2, 3, 4, 5]
y = [2, 0, 4, 8, 3]
y2 = [8, 4, 0, 3, 2]
fig = go.Figure()
fig.add_trace(go.Scatter(
x=x,
y=y,
mode=‘lines’
))
fig.add_trace(go.Scatter(
x=x,
y=y2,
mode=‘lines+markers’
))
fig.show()