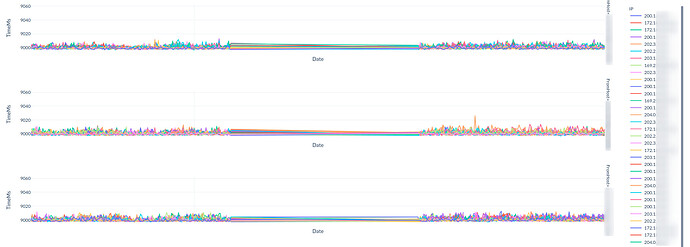
I’d like to be able to sort the IPs legend on the right.
Is there a way to sort legend when using express line with color argument?
Code:
def network_clusters_timems_charts():
    df = pd.read_csv('cluster-network-monitoring.csv')
    df.sort_values(by='Timestamp', inplace=True)
    df['Timestamp'] = pd.to_datetime(df['Timestamp'])
    fig = px.line(df, x="Timestamp", y="TimeMs", color="IP",
                 facet_row="FromHost", facet_row_spacing=0.1,
                 template="plotly_white"
                 )
    fig.update_layout(
        title='Cluster Network',
        autosize=True,
        height=1200,
        font_family="Lato",
    )
    fig.update_xaxes(title='Date', tickmode='linear', tickangle=45,
                     tickfont=dict(family='Lato', size=12))
    fig.update_yaxes(title='TimeMs')
    plot_div = plot(fig, output_type='div', include_plotlyjs=True, config=dict(responsive=True))
    return plot_div
