Is there a way to set values as percentage?

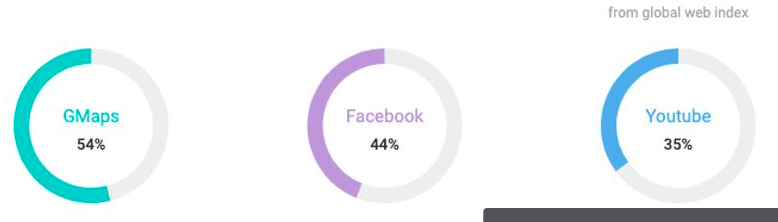
Hi i need to create a chart like the image below. I create a pie chart with a hole but i am unable to set one value because i couldn’t find a way to set the value as percentage. If i give just one value library automatically calculates as %100.

Another question; is there a way to show the values outside in a pie chart with a line like the image below? I know i can set the position as outside but it doesn’t draw lines.

Screenshot from 2020-06-26 14-48-46

Thank you so much!

Hey @ahmetb, although this might come a bit late, I recently encountered this issue and discovered a solution, which I’d like to share for anyone who might find it useful in the future.

You can achieve the desired outcome in the first case by using Plotly Graph Objects’ hole property and annotations in Python. Here’s an example code snippet:

import plotly.graph_objects as go

# Define the percentage
kpi_value = 75

def get_pie_percentage_parameters(kpi_value, kpi_color: str = '#8959B5', grey_color: str = '#DCDCDC') -> dict:
    return {
        'labels': ['kpi', 'grey'],
        'colors': [kpi_color, grey_color],
        'values': [kpi_value, 100 - kpi_value]
    }

params = get_pie_percentage_parameters(kpi_value)

fig = go.Figure(data=[go.Pie(labels=params['labels'], values=params['values'], hole=.9, marker_colors=params['colors'])])


fig.update_layout(showlegend=False, annotations=[{'text': f'{kpi_value}%', 'font_size':148, 'showarrow':False, 'xanchor':"center"}])
fig.update_traces(textinfo='none')

This code should result in:

Plotly’s JSON structure is largely consistent across programming languages, making it straightforward to update the same parameters when working with Plotly.js.

If you wish to adjust labels like “GMaps,” “Facebook,” or “YouTube,” consider refining the annotation positioning within the Figure object.

I hope this guidance proves helpful for anyone tackling a similar challenge in the future.