For example, I have a dataframe that looks like this:
Date 	2020 	2021 	2022 	2023 	2024 	2020-09 	2020-12 	2021-03 	2021-04 	2021-05 	... 	2023-04 	2023-06 	2023-09 	2023-10 	2023-12 	2024-01 	2024-02 	2024-03 	2024-04 	2024-05
Started 	2 	24 	12 	6 	12 	1 	1 	3 	7 	0 	... 	1 	1 	0 	1 	1 	3 	1 	2 	4 	2
Finished 	1 	23 	13 	6 	13 	0 	1 	2 	8 	1 	... 	0 	0 	1 	2 	0 	3 	2 	1 	4 	3
The first 5 columns are years, while the rest of the columns are broken up into year-months. I want to have a dropdown that lets me switch bar charts between Year and Year-Month.
For example, my Yearchart by itself looks like this:

and the Year-Month chart by itself looks like this:
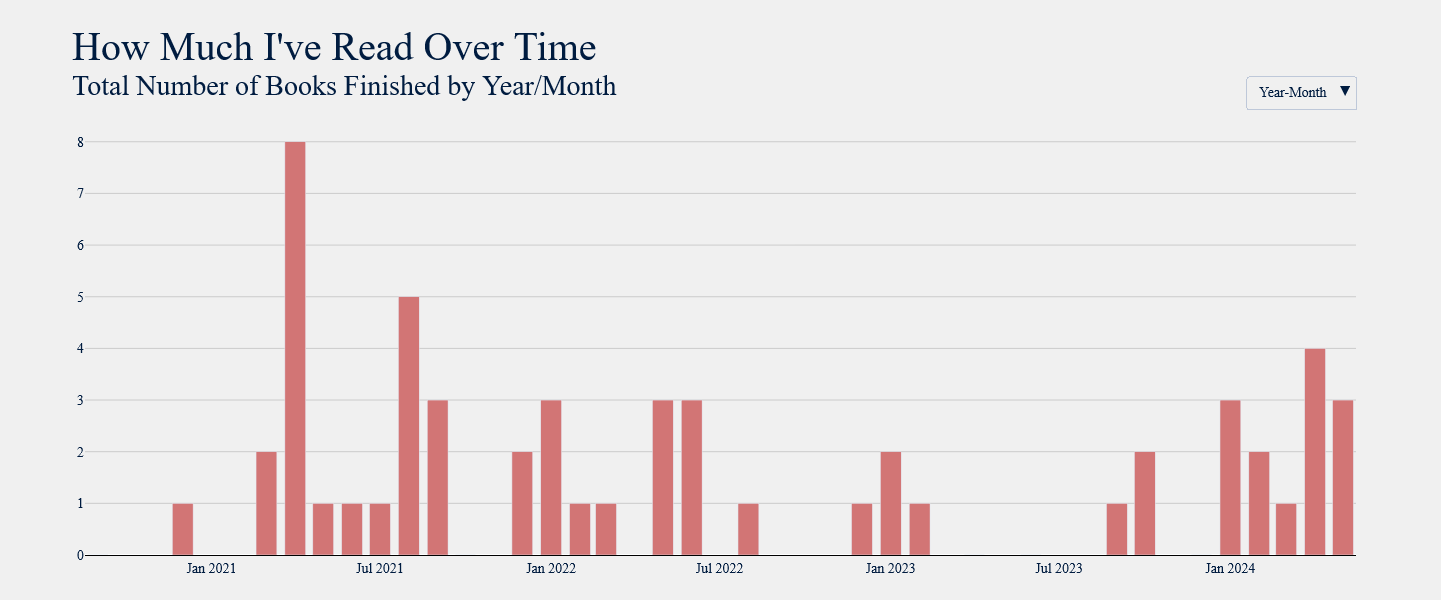
However, when I try to implement a chart that uses the button to swap back and forth, it breaks the x-axis:

Not only does it seem to combine both sets of ticks/labels, but it seems to skip every other one. I don’t know if the way I’ve approached this problem is smart, dumb, or in-between - but if anyone has any guidance on how to achieve this, it would be greatly appreciated!
Below is the function I have used to create this:
def gen_time_graph(df, col1, title, sub):
    """
    Produces a simple bar graph with the given dataframe and column.

    df: dataframe containing relevant data
    col: data to be displayed along x-axis
    """
    times = ['Year', 'Year-Month']
    active = 0

    fig = go.Figure()
    for k, time in enumerate(times):
        if k == 0: #"Year"
            dft = df[[x for x in df.columns if len(x)==4]]
        else:
            dft = df[[x for x in df.columns if len(x)>4]]

        labels = [x for x in dft.columns]
        colors = ['#d27575', '#529b9c', '#eac392', '#9cba8f', '#675a55'] * len(labels)
        label_dict = {time: labels}
        buttons_opts = gen_buttons(times)

        for j, col in enumerate(labels):
            fig.add_trace(
                go.Bar(
                    x=[labels[j]],
                    y=[dft.loc['Finished', col]],
                    customdata = [col] * len(labels),
                    name='',
                    marker_color=colors,
                    showlegend=False,
                    hovertemplate="<b>Books Finished in %{customdata}</b>: %{y}",
                    visible=True if k == active else False
                )
            )

    # Define buttons for dropdown
    fig.update_layout(updatemenus = gen_menu(active, buttons_opts))
and the gen_buttons() function:
def gen_buttons(vals, multi=0, labels=[]):
    """
    Generates dropdown menu buttons.

    vals: list of values to turn into buttons
    """
    buttons_opts = []
    i = 0
    for val in vals:
        if multi:
            multivals = [v for v in vals for i in range(3)]
            args = [False] * len(multivals)
            args[i:i+3] = [True] * 3
            i += 3
        else:
            args = [False] * len(vals)
            args[i] = True
            i += 1

        buttons_opts.append(
            dict(
                method='update',
                label=val,
                args=[{
                    'visible': args, #this is the key line!
                    'title': val,
                    'showlegend': False,
                    'xaxis_ticktext': labels
                }]
            )
        )
    return buttons_opts
and last, the gen_menu() function:
def gen_menu(active, buttons):
    """
    Generates menu configurations for dropdown.

    active: default button to have upon generation
    buttons: list of different menu options
    """
    updatemenus = [
        go.layout.Updatemenu(
            active=active,
            buttons=buttons,
            x=1.0,
            xanchor='right',
            y=1.1,
            yanchor='top'
        )
    ]
    return updatemenus
Can someone help guide me in the right direction? I feel like this must be possible, and I’m either not seeing the solution, or I’ve severely over-complicated things. Thank you!