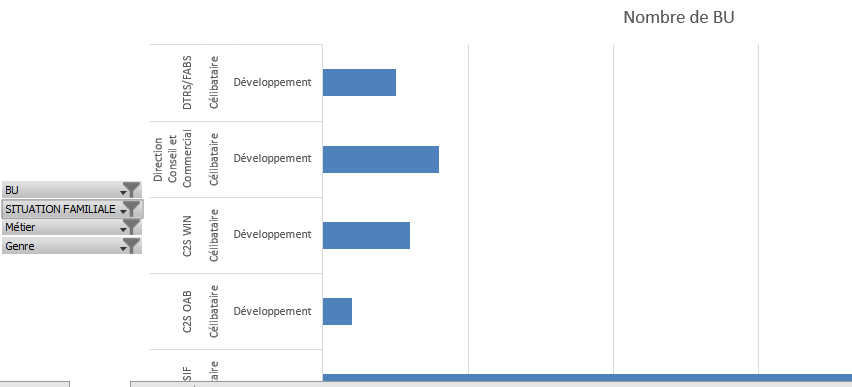
i want to create an interactive histogram (like in excel where i can choose filters )
the user will control the filters he want to plot on the histogram
is it possible ?
Note : (BU,Métier ,…) are the name of columns
Like this from excel ==>
Thank you for response !
i have 4 columns and the values are categorical !
i want to choose some filter from each column and change it !
Example : column 1 : sexe : Male or female ( you can choose both)
column 2 : familial statut : divorced married …
column 3 : Bussiness unit : there are 12 categories
and i want to create interactive histogram where the user see the result if he choose female married who works on specific bussiness unit