Hello,
I have a dataframe that contains data with hierarchy. The first/top level is a household, then the accounts in the household and the lowest level contains the security positions in each account. I have the market value of the positions and with function “aggFunc”: “sum” I can aggregate the market values to account level and then household level.
However, now I want to create a new column name “% of portfolio” that at security position level shows the weight of each security positions in their parent account, but at the account level shows the weight of the account market value in the household exactly like the ‘% of portfolio’ column that I have in the screen shot. I am wondering whether there is a way to do this using AgGrid?
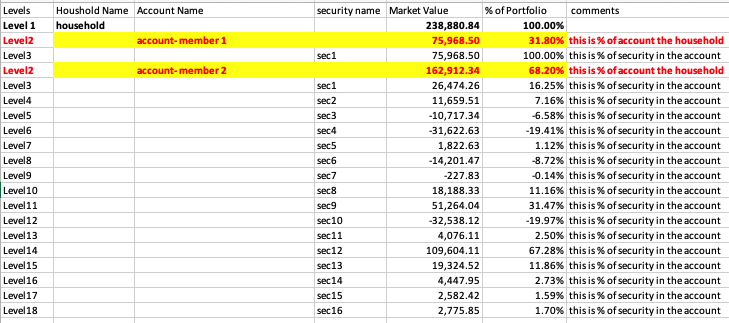
For example, sec1 at level3 is the only position in the account-member1 so it gets 100% weight as we are calculating the weight of this security in its account. But account-member1 itself gets 31.8% weight as we want to shows the contribution of this account in its parent level, which is the household level.
Appreciate any idea that helps with solving the problem.
Lili
Hi @jinnyzor , just wondering if you have any expert opinion on the above? whether this is possible at all?
Thank you!
Lili
Hello @Lili2023,
Do you have a test dataset that I could work with?
I’m curious, is this something easier to calculate on the server side rather than having the grid calculate it?
I’m sure AG Grid enterprise would be able to group these things for you if you wanted to go that route.
Thank you @jinnyzor. Here is the data.
| Household_name |
Account_name |
Security Name |
Market Value |
| HH |
acc_1 |
Canadian Dollar |
26,978.99 |
| HH |
acc_1 |
APPLE INC |
820,097.39 |
| HH |
acc_1 |
VANGUARD S&P 500 ETF |
625,108.12 |
| HH |
acc_1 |
VANGUARD TOTAL BOND MARKET |
169,061.31 |
| HH |
acc_2 |
Cash Management Pool |
10,000.23 |
| HH |
acc_2 |
US Equity Growth Corporate Class |
5,620.39 |
| HH |
acc_2 |
International Equity Growth Corp Class |
9,301.22 |
| HH |
acc_2 |
High Interest Savings Fund |
1,197.29 |
| HH |
acc_2 |
US Equity Value Corporate Class |
8,859.47 |
| HH |
acc_2 |
US Equity Alpha Corp Class |
8,221.70 |
| HH |
acc_2 |
International Equity Alpha Corp Class |
4,207.13 |
| HH |
acc_2 |
BANK OF NOVA SCOTIA |
68,190.00 |
| HH |
acc_2 |
Canadian Equity Growth Corporate Class |
19,165.92 |
| HH |
acc_2 |
Canadian Equity Alpha Corp Class |
8,802.13 |
| HH |
acc_2 |
PAYPAL HOLDINGS INC |
100,395.21 |
| HH |
acc_2 |
Canadian Equity Value Corporate Class |
7,897.12 |
| HH |
acc_2 |
International Equity Value Corp Class |
8,124.97 |
| HH |
acc_2 |
Marret Alternative Absolute Return Bond Fund |
7.42 |
| HH |
acc_2 |
APPLE INC |
223.34 |
| HH |
acc_2 |
Canadian Dollar |
54,241.05 |
| HH |
acc_3 |
Private Residential Home Fund |
158,829.52 |
| HH |
acc_3 |
Canadian Dollar |
658,414.38 |
| HH |
acc_3 |
Private Energy Fund IV |
320,600.94 |
| HH |
acc_3 |
Private Farmland Fund III |
154,419.95 |
| HH |
acc_3 |
Private Technology Fund |
527,232.82 |
| HH |
acc_3 |
Private Real Estate Fund II |
237,114.94 |
| HH |
acc_3 |
Private Infrastructure Fund IV |
470,016.93 |
| HH |
acc_3 |
Private Venture Fund |
174,450.09 |
the desired results is this:
| Household_name |
Account_name |
Security Name |
Market Value |
% of Portfolio |
| HH |
|
|
4,656,779.98 |
100.00% |
| HH |
acc_1 |
|
1,641,245.81 |
35.24% |
| HH |
acc_1 |
Canadian Dollar |
26,978.99 |
1.64% |
| HH |
acc_1 |
APPLE INC |
820,097.39 |
49.97% |
| HH |
acc_1 |
VANGUARD S&P 500 ETF |
625,108.12 |
38.09% |
| HH |
acc_1 |
VANGUARD TOTAL BOND MARKET |
169,061.31 |
10.30% |
| HH |
acc_2 |
|
314,454.59 |
6.75% |
| HH |
acc_2 |
Cash Management Pool |
10,000.23 |
3.18% |
| HH |
acc_2 |
US Equity Growth Corporate Class |
5,620.39 |
1.79% |
| HH |
acc_2 |
International Equity Growth Corp Class |
9,301.22 |
2.96% |
| HH |
acc_2 |
High Interest Savings Fund |
1,197.29 |
0.38% |
| HH |
acc_2 |
US Equity Value Corporate Class |
8,859.47 |
2.82% |
| HH |
acc_2 |
US Equity Alpha Corp Class |
8,221.70 |
2.61% |
| HH |
acc_2 |
International Equity Alpha Corp Class |
4,207.13 |
1.34% |
| HH |
acc_2 |
BANK OF NOVA SCOTIA |
68,190.00 |
21.69% |
| HH |
acc_2 |
Canadian Equity Growth Corporate Class |
19,165.92 |
6.09% |
| HH |
acc_2 |
Canadian Equity Alpha Corp Class |
8,802.13 |
2.80% |
| HH |
acc_2 |
PAYPAL HOLDINGS INC |
100,395.21 |
31.93% |
| HH |
acc_2 |
Canadian Equity Value Corporate Class |
7,897.12 |
2.51% |
| HH |
acc_2 |
International Equity Value Corp Class |
8,124.97 |
2.58% |
| HH |
acc_2 |
Marret Alternative Absolute Return Bond Fund |
7.42 |
0.00% |
| HH |
acc_2 |
APPLE INC |
223.34 |
0.07% |
| HH |
acc_2 |
Canadian Dollar |
54,241.05 |
17.25% |
| HH |
acc_3 |
|
2,701,079.58 |
58.00% |
| HH |
acc_3 |
Private Residential Home Fund |
158,829.52 |
5.88% |
| HH |
acc_3 |
Canadian Dollar |
658,414.38 |
24.38% |
| HH |
acc_3 |
Private Energy Fund IV |
320,600.94 |
11.87% |
| HH |
acc_3 |
Private Farmland Fund III |
154,419.95 |
5.72% |
| HH |
acc_3 |
Private Technology Fund |
527,232.82 |
19.52% |
| HH |
acc_3 |
Private Real Estate Fund II |
237,114.94 |
8.78% |
| HH |
acc_3 |
Private Infrastructure Fund IV |
470,016.93 |
17.40% |
| HH |
acc_3 |
Private Venture Fund |
174,450.09 |
6.46% |
Nice portfolio! However looks a little overweight in Paypal 
2 Likes
Something like this?
app.py
import dash_ag_grid as dag
from dash import Dash, html, Input, Output
import pandas as pd

app = Dash(
        __name__
    )

df = pd.read_csv('Book1.csv')

columnDefs = [{'field': i} for i in df.columns]

for i in range(2):
    columnDefs[i]['rowGroup'] = True
    columnDefs[i]['hide'] = True

columnDefs[-1]['aggFunc'] = 'sum'
columnDefs[-1]['valueFormatter'] = {'function': 'params.value ? d3.format("($,.2f")(params.value) : null'}
columnDefs[-2]['valueFormatter'] = {'function': 'params.value ? params.value : '
                                                '(params.node.field == "Account_name" ? params.node.key : "Total")'}
columnDefs.append({'headerName': '% of Portfolio',
                   'valueFormatter': {'function': 'percentPortfolio(params)'}})

app.layout = html.Div(
    [
        dag.AgGrid(
            id="grid",
            columnDefs=columnDefs,
            rowData=df.to_dict('records'),
            enableEnterpriseModules=True,
            dashGridOptions={"suppressAggFuncInHeader": True,}
        ),
    ]
)

app.run(debug=True)
js:
dagfuncs.percentPortfolio = function (params) {
  if (params.node.group) {
    child = params.node.aggData
    parent = params.node.parent.aggData
    cat = 'Household'
  } else {
    child = params.data
    parent = params.node.parent.aggData
    cat = params.node.parent.key
  }
  return `${Math.round((child['Market Value'] / parent['Market Value'] * 10000))/100}% of ${cat}`
}
2 Likes
Thank you @jinnyzor! Yes, this is what I want, (ideally without the text in the % of Portfolio). Though from looking at the code we basically need that part to define our nodes.
You can make it say whatever you need it to say.
I thought what I put was helpful to understanding the data. Haha. XD
1 Like
