When I use the range slider to zoom then everything works. Cool.
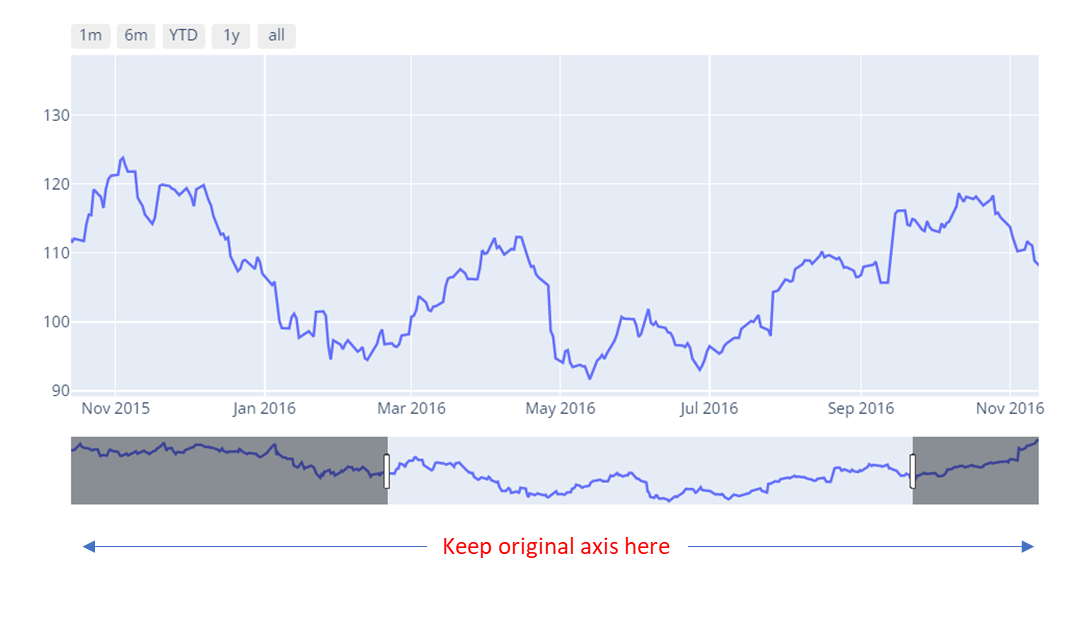
But after zooming I don’t recall what were the original x-axes… the plot now only shows the result after zoom. Is there a way to draw under the rangeslide the xaxis that it is using for its plot?
Thanks, T.