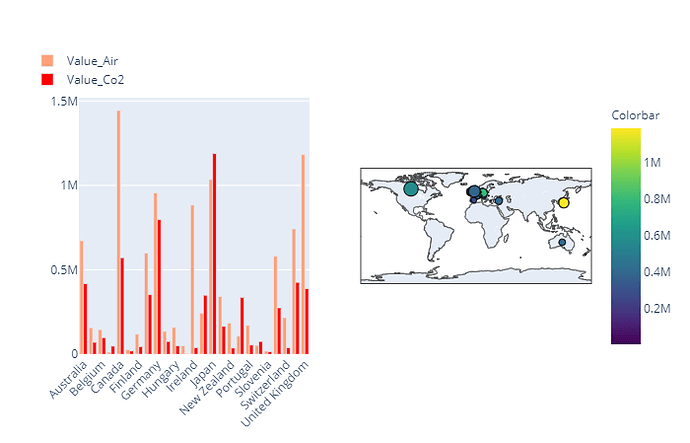
How can add slider, for animate these charts according to the year?
This is the code
fig.add_trace(go.Scattergeo(
        locationmode = 'ISO-3',
        locations=dataset['iso_alpha'],
        text = dataset['Country'],
        mode = 'markers',
        showlegend = False,
        marker = dict(
            size = (dataset['Value_Air']-minValue)/100000,
            colorscale = 'Viridis',
            color = dataset['Value_Co2'],
            colorbar=dict(
            title="Colorbar"
        ),
        )),
        row=1, col=2
)
fig.update_layout(legend=dict(x=-.1, y=1.2))

fig.add_trace(
    go.Bar(x=dataset["Country"],y=dataset["Value_Air"],marker_color='lightsalmon', name='Value_Air'),
    row=1, col=1
)


fig.add_trace(go.Bar(
    x=dataset["Country"],
    y=dataset["Value_Co2"],
    name='Value_Co2',
    marker_color='red'
))
I read this https://plotly.com/python/ but I don’t understand.
The years are saved in dataset[“Year”]
And why the zoom button work only with Bar and not with Scattergeo??
Can someone help me, please?
