hello everyone,
I would like to know if it is possible to insert several pie charts on a map (you can see an example on the picture). My searchs on the web have been unsuccessful.
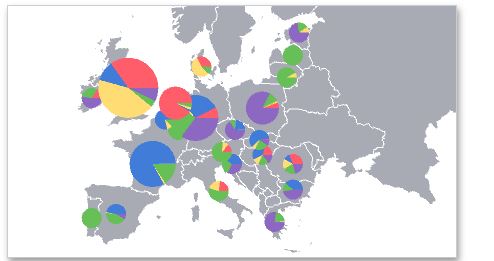
Thank you for your help.
hello everyone,
I would like to know if it is possible to insert several pie charts on a map (you can see an example on the picture). My searchs on the web have been unsuccessful.
Thank you for your help.
You could try mini charts,
Perfect. thanks a lot
Greetings,
I have a similar requirement. You have saved me lot of time. The link has changed.
Thank you
I have an elegant solution that might be helpful, I’m using Custom Pie Chart Cluster and Icons on individual location-based on Leaflet GeoJSON::
# dash_extentions.javascript import assign
point_to_layer_js = assign("""function(feature, latlng){
    const flag = L.icon({iconUrl: `https://cdn.discordapp.com/attachments/419291925322006528/1178069819707359242/mining_site1.png?ex=6574ce04&is=65625904&hm=8c23df4651c5a131cbfb37ee155aa1edd0e7c9608a33f9bcc862df09875396b9&`, iconSize: [64, 48]});
        return L.marker(latlng, {icon: flag});
}
""")
cluster_to_layer = assign("""function(feature, latlng, index, context){
function getRandomInt(min, max) {
  return Math.floor(Math.random() * (max - min + 1)) + min;
}

function ringSVG(opt) {
  function describeArc(opt) {
    const innerStart = polarToCartesian(opt.x, opt.y, opt.radius, opt.endAngle);
    const innerEnd = polarToCartesian(opt.x, opt.y, opt.radius, opt.startAngle);
    const outerStart = polarToCartesian(opt.x, opt.y, opt.radius + opt.ringThickness, opt.endAngle);
    const outerEnd = polarToCartesian(opt.x, opt.y, opt.radius + opt.ringThickness, opt.startAngle);
    const largeArcFlag = opt.endAngle - opt.startAngle <= 180 ? "0" : "1";
    return [ "M", outerStart.x, outerStart.y,
             "A", opt.radius + opt.ringThickness, opt.radius + opt.ringThickness, 0, largeArcFlag, 0, outerEnd.x, outerEnd.y,
             "L", innerEnd.x, innerEnd.y,
             "A", opt.radius, opt.radius, 0, largeArcFlag, 1, innerStart.x, innerStart.y,
             "L", outerStart.x, outerStart.y, "Z"].join(" ");
  }

  const polarToCartesian = (centerX, centerY, radius, angleInDegrees) => {
      return { x: centerX + (radius * Math.cos((angleInDegrees - 90) * Math.PI / 180.0)),
               y: centerY + (radius * Math.sin((angleInDegrees - 90) * Math.PI / 180.0)) };
  }

  opt = opt || {};
  const defaults = { width: 60, height: 60, radius: 20, gapDeg: 5, goodPerc: 75, fontSize: 17, text: `test`,
                     ringThickness: 7, goodColor: 'green', badColor: 'red'};
  opt = {...defaults, ...opt};

  const badPercDeg = 360 * (100 - opt['goodPerc']) / 100;
  const stdOpt = {x: opt['width']/2, y: opt['height']/2, radius: opt['radius'], ringThickness: opt['ringThickness']};
  const dGreen = describeArc({...stdOpt, startAngle: 90, endAngle: 450 - badPercDeg - opt['gapDeg']});
  const dRed   = describeArc({...stdOpt, startAngle: 450 - badPercDeg, endAngle: 450 - opt['gapDeg']});
  const path1 = `<path class="path1" fill="${opt['goodColor']}" d="${dGreen}"></path>`
  const path2 = opt['goodPerc'] < 100 ? `<path class="path2" fill="${opt['badColor']}" d="${dRed}"></path>` : '';
  return `<svg id="svg" width="${opt['width']}" height="${opt['height']}">
            ${path1} ${path2}
            <text x="50%" y="50%" alignment-baseline="middle" text-anchor="middle" font-size="${opt['fontSize']}"
                  fill="black"> ${opt['text'] || opt['goodPerc']}
            </text>
          </svg>`;
}
/*********************/

    const {min, max, colorscale, circleOptions, colorProp} = context.hideout;
    const csc = chroma.scale(colorscale).domain([min, max]);

    // Set color based on mean value of leaves.
    const leaves = index.getLeaves(feature.properties.cluster_id);
    let valueSum = 0;
    for (let i = 0; i < leaves.length; ++i) {
        valueSum += leaves[i].properties[colorProp]
    }
    const valueMean = valueSum / leaves.length;

    // icon background color
    const scatterIcon = L.DivIcon.extend({
        createIcon: function(oldIcon) {
               let icon = L.DivIcon.prototype.createIcon.call(this, oldIcon);
               return icon;
        }
    });

    // Render a circle with the number of leaves written in the center.
    const total = feature.properties.point_count_abbreviated;
    const numOffline = getRandomInt(0, total);
    const numOnline = total - numOffline;
    const goodPerc = numOnline / total * 100;

    const icon = new scatterIcon({
        html: ringSVG({
                text:`${total-numOffline}/${total}`,
                goodPerc,
                width: 70,
                height: 70,
                radius: 15,
                fontSize: 12,
                ringThickness: 5,
            }),
        className: "marker-cluster",
        iconSize: L.point(40, 40),
        className: "marker-cluster",
        iconSize: L.point(40, 40),
        color: csc(valueMean)
    });
    return L.marker(latlng, {icon : icon})
}
""")
GeoJson & map:
cities = dl.GeoJSON(
    data=geobuf,
    format='geobuf',
    cluster=True,
    zoomToBoundsOnClick=True,
    superClusterOptions=dict(radius=40),
    hideout=dict(
        circleOptions=dict(fillOpacity=1, stroke=False, radius=3),
        min=0,
    ),
    pointToLayer=point_to_layer_js,
    clusterToLayer=cluster_to_layer,
)

dl.Map([
                    dl.TileLayer(),
                    cities
                ],
                    style={'width': '100%', 'height': '100vh'},
                    center=[40, -74],  # y, x
                    zoom=7
                )
