Let me demonstrate with an example. Let’s take the simple line plot shown here, the first figure in the Plotly user guide:
from plotly.offline import download_plotlyjs, init_notebook_mode, plot, iplot
import plotly.graph_objs as go

trace1 = go.Scatter(x=[1,2,3], y=[4,5,6], marker={'color': 'red', 'symbol': 104, 'size': 10},
                    mode="markers+lines",  text=["one","two","three"], name='1st Trace')

data=go.Data([trace1])
layout=go.Layout(title="First Plot", xaxis={'title':'x1'}, yaxis={'title':'x2'})
figure1=go.Figure(data=data,layout=layout)
init_notebook_mode(connected=True)
iplot(figure1)

Now, say I want to update the x-tick labels to 'A', 'B', 'C' and the ytick labels to 'E', 'F', 'G'. I can do that by updating the figure like so:
figure1['data'][0]['x']=['A', 'B', 'C']
figure1['data'][0]['y']=['E', 'F', 'G']

iplot(figure1)

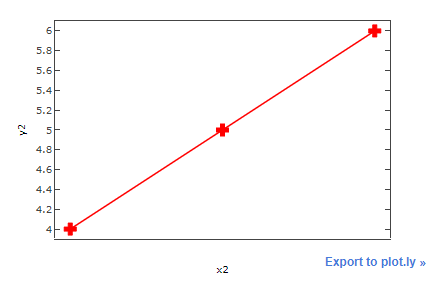
So far so good. However, let’s say I first plot the figure using matplotlib, then convert to plotly like so:
import matplotlib.pyplot as plt
import plotly.tools as tls

plt.plot([1,2,3], [4,5,6], 'r+-', markersize=10)
plt.xlabel('x2')
plt.ylabel('y2')

mpl_fig = plt.gcf()
figure2 = tls.mpl_to_plotly(mpl_fig)

init_notebook_mode(connected=True)
iplot(figure2)

This is relevant when, say, the library you are using to plot the figures was designed to work with matplotlib only (or maybe seaborn at max). But you want to make the plots dynamic/interactive and use them in plotly.
This time if I try to update the figure in the exact same way as before, I get a blank figure!
figure2['data'][0]['x']=['A', 'B', 'C']
figure2['data'][0]['y']=['E', 'F', 'G']

iplot(figure2)

Not only is it a blank figure, the xtick labels and ytick labels are also left unchanged.
When I look deeper what is contained in figure1['data'][0]['x'], I see that its a tuple:

And when I check what is contained in figure2['data'][0]['x'], it is also the same exact tuple:

Same goes for figure1['data'][0]['y'] and figure2['data'][0]['y'] - they both contain the tuple ('E', 'F', 'G').
So, what’s going on? Why does figure2 not get plotted after updating the tick labels? How can I fix it?